Northern School Districts See Lots More Deals
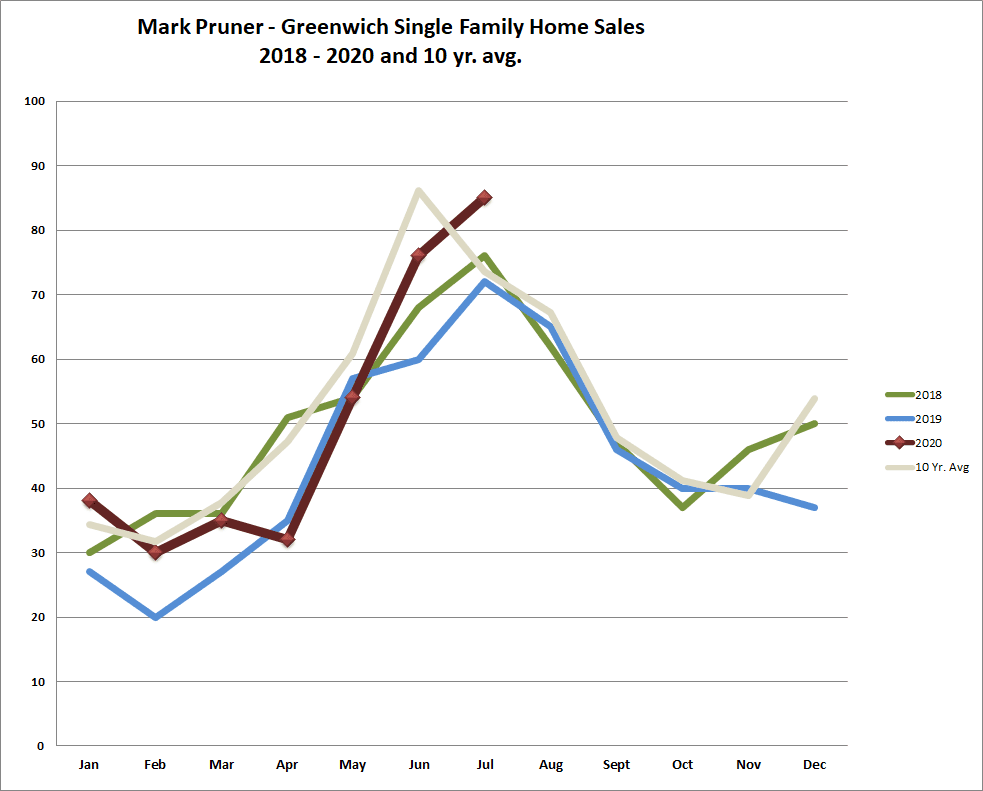
In July 2020, we had 85 sales of a single-family home in Greenwich. This blew away last year when we had 72 sales and is above our 10-year average of 74 sales. The sales are impressive, but what is really astounding is that we have 208 contracts waiting to close. This is up 119% from last year when we had a fairly normal 95 contracts at the end of July 2019. Contracts are up in every price range with a big jump in contracts between $1 and 4 million. Even our contracts over $4 million are up 21 contracts from last year going from 13 contracts to 34 contracts a jump of 161%.
Our 10-year average for sales in August is 67 houses, so if a third of the houses under contract close in August we will still exceed our August average. The odds are that we are going to see a lot more than that. Of those 208 contracts, 148 are between $1 and $4 million, which means in Greenwich that most of those 148 families have school-age children who want to be in their house before the school year starts.
July 2020 is also the third year in a row with more sales in July than in June, our traditional high sales month. It looks like we have a real market change with sales getting more complicated and shifting later in the year. The result is that the first half of the year is just not going to look as good, since sales are shifting from June to July. What is going to be interesting is that August actually has a good chance this year of exceeding our already high July sales.
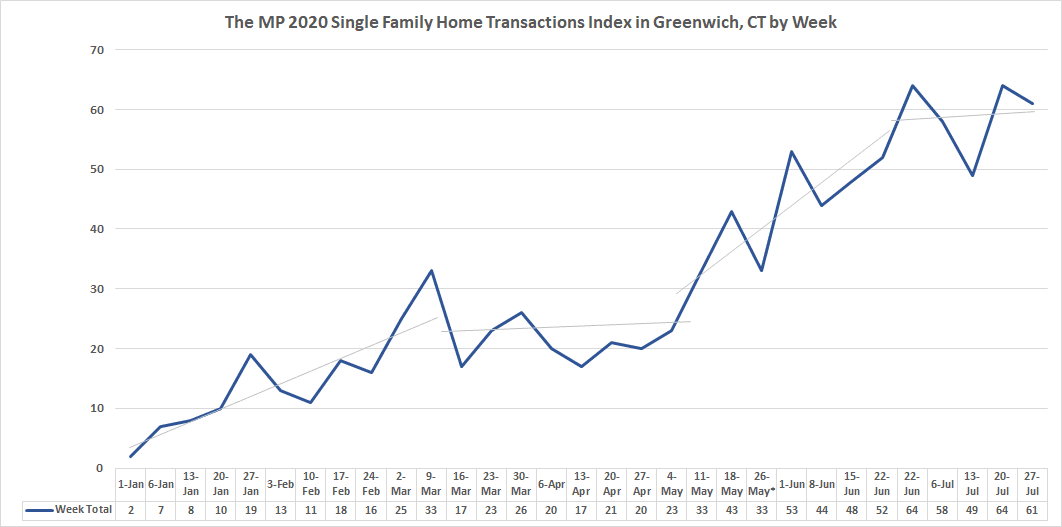
When you look back over the year you can see the market went through four phases this year. We opened the year with a typical run-up in transactions; i.e., sales and contracts. Everything was looking pretty normal in this first phase with transactions steadily rising, until the second phase, Covid lockdown came. We went from a good 33 transactions in the second week of March to only 17 transactions in the third week. While we never stopped showing houses, lots of people put off looking and our transactions dropped to an average of 20 transactions per week through the first week in May.
Starting with the second week of May, transactions increased steadily going from 33 transactions in the first week of the third phase all the way up to 64 transactions in the third week of June when we reached the fourth phase that we are now. What we are seeing is a persistent high plateau of transactions with about 60 transactions each week for the last 5 weeks now.
|
Inventory as of 12/1/21
|
Inventory
|
Contracts
|
Last Mo. Solds
|
Last Month Solds+ Contracts
|
YTD Solds
|
YTD+ Contracts
|
Months of Supply
|
MoS w/ Contracts
|
Last Mo. MoS Annlzd
|
|
< $600K
|
4 |
4 |
3 |
7
|
9 |
13 |
3.1 |
2.6 |
1.3 |
|
$600-$800K
|
11 |
13 |
4 |
17 |
19 |
32 |
4.1 |
2.9 |
2.8 |
|
$800K-$1M
|
23 |
9 |
9 |
18 |
26 |
35 |
6.2 |
5.6 |
2.6 |
|
$1-$1.5M
|
68 |
26 |
10 |
36 |
67 |
93 |
7.1 |
6.2 |
6.8 |
|
$1.5-$2M
|
66 |
41 |
12 |
53 |
54 |
95 |
8.6 |
5.9 |
5.5 |
|
$2-$3M
|
116 |
47 |
20 |
67 |
79 |
126 |
10.3 |
7.8 |
5.8 |
|
$3-$4M
|
83 |
34 |
11 |
45 |
50 |
84 |
11.6 |
8.4 |
7.5 |
|
$4-$5M
|
42 |
12 |
3 |
15
|
15 |
27 |
19.6 |
13.2 |
14.0 |
|
$5-6.5M
|
52 |
11 |
2 |
13 |
13 |
24 |
28.0 |
18.4 |
26.0 |
|
$6.5-$10M
|
53
|
7 |
2 |
9 |
7 |
14 |
53.0
|
32.2 |
26.5 |
|
> $10M
|
37 |
4
|
1 |
5 |
5 |
9 |
51.8 |
34.9 |
37.0 |
| |
|
|
|
|
|
|
|
|
|
|
TOTAL
|
555
|
208
|
77
|
285
|
344
|
552
|
11.3
|
8.5
|
7.2 |
As transactions increased, new listings followed, which is normally just the opposite in our market. In a normal year, inventory comes on in February, March, and April, goes to contract in April and May, and closes in June and July. This year, our contracts started rising in the first week of June and surged through the rest of the month, and only then did we start seeing more inventory. Of course, you might not notice the new inventory coming on if you only looked at the bottom line numbers. New contracts have been at such a rapid pace that they are actually pulling down our inventory at a time the owners are listing an unprecedented number of houses for July.
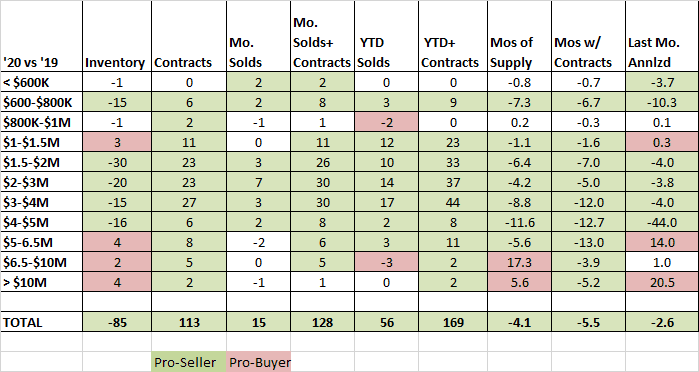
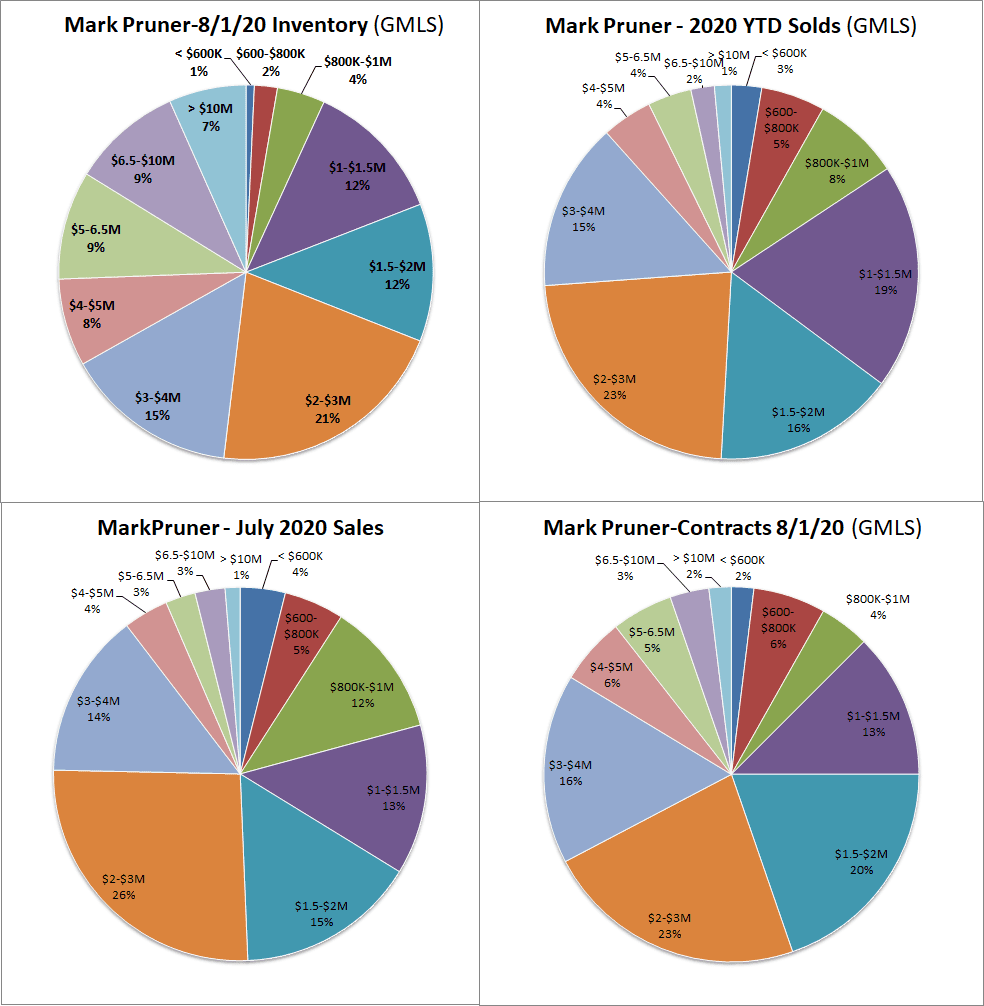
The increase in sales, as mentioned, is across the board from $600K to $10 million plus. The only category where sales are not up is under $600K where we have 9 sales YTD plus 4 contracts with an inventory of only 4 houses leading to only 2.6 months of supply, i.e. very hot. If we had more listings under $600K we had more sales. You can pick any price category and it’s much more pro-seller this year. Out total sales even with the Covid lockdown phase are still up 48 sales or 19% from last year.
If you are thinking about buying or selling a house you want to look at contracts not sales since contracts tell you what the market demand is now.
-
Demand has increased the most by over $1.5 million with an average increase in contracts of 189%.
-
The biggest jump in deals is from $3 – 4 million where we have 34 contracts compared to only 7 contracts in July 2019, an increase of 386%.
-
The market from $4 – 5 million has also changed a lot. We only have 6 more contracts, but 16 fewer listings. Months of supply in this price category have dropped by more than a year to 13.2 months of supply from 24.8 months of supply in July 2019.
-
We have seen a slight uptick in inventory over $5 million with 142 listings compared to 132 listings in 2019 or 7.5%, but don’t worry too much as we have also seen a big jump in contracts from 7 last year to 22 deals in 2020.
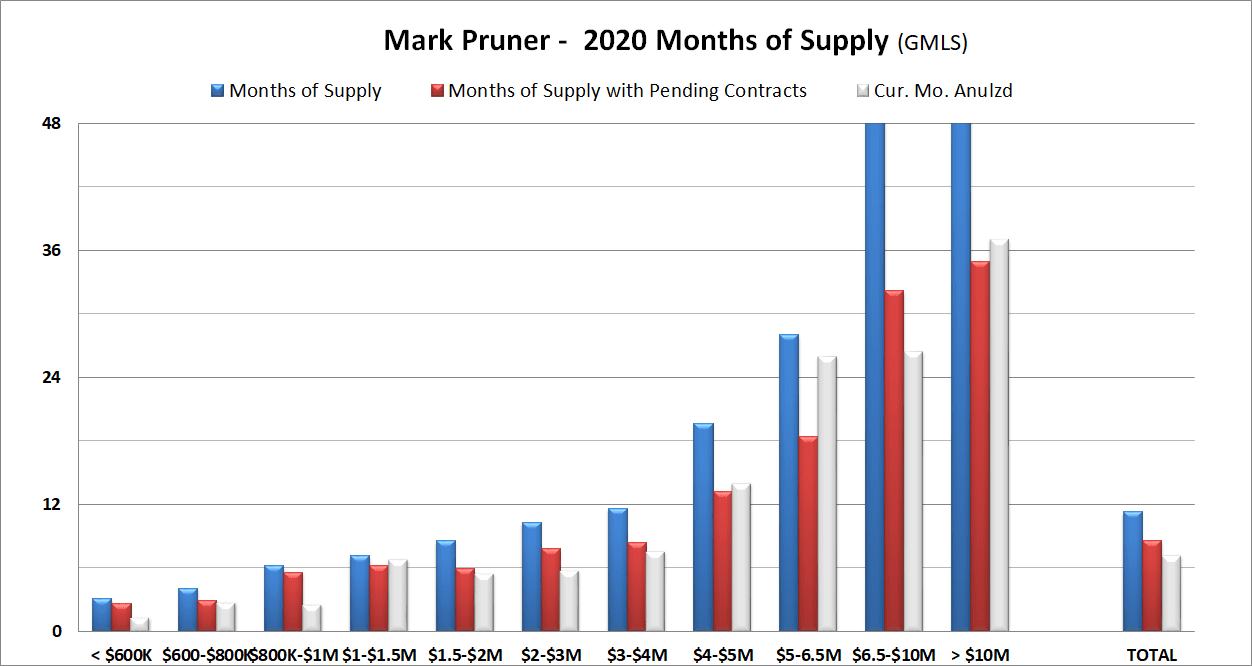
When you look at months of supply what jumps out is just how remarkable July is. If you take sales and contracts every category is getting tighter. If you look at just deals that close in July and analyze them, everything up to $4 million dollars is accelerating. The other thing is just the absolute numbers.
For most of the U.S., anything under 6 months' supply is considered a seller’s market, but the median price for a home sale in the US is $329,000; i.e., half of the houses in the U.S. sell for less than $329K. The last time a house sold in Greenwich for less than that amount was in 2012. The idea of 6 months of supply being a seller’s market only works up to about $2 million. Above $3 million it's more like one year of supply and above $5 million it's probably 18 months of supply. A very high-end house just takes longer to sell. Based on those criteria we have a seller’s market all the way up to $6.5 million.
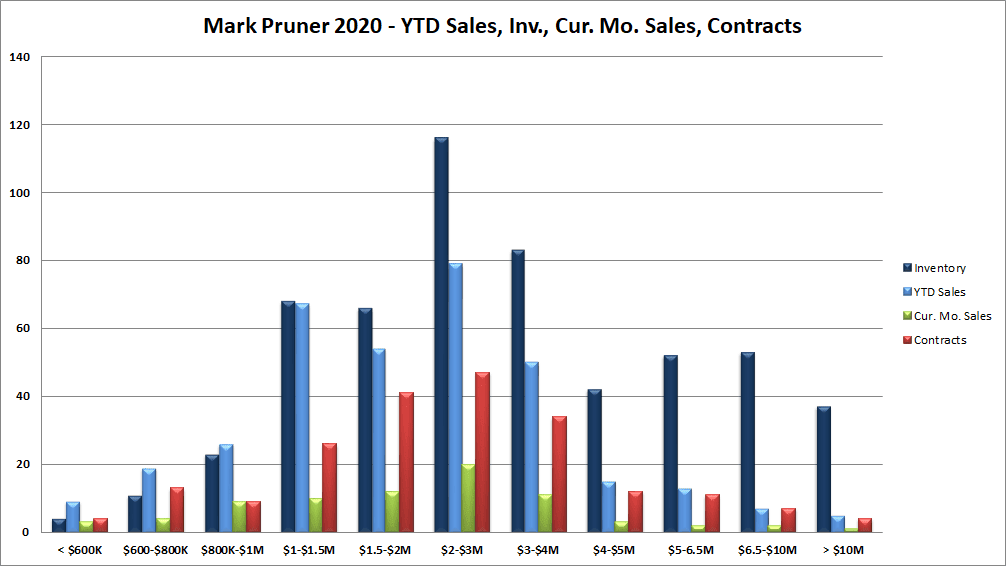
When you look at where the contracts are they are concentrated between $1 million and $4 million where we have 148 contracts or 71% of all contracts. This price range covers successful young families at the lower end and folks looking for a weekend house at the upper end. Also, we continue to see an increase in Greenwich buyers who realize that now is the time to buy before prices go up since our median price is already up 5.6% this year. Curiously, that is not where to focus.
Lots of people and the press focus on what is happening to the average sales price of houses and that is not a good number to look at in Greenwich if what you are trying to do is to see where the overall market is going and the median price is only a little better. Most years, the change in the average price is not due to changes in overall market demand, but due more to the mix of what is selling. Given the broad increase in sales and contracts, 2020 may be the exception to that rule as we are seeing an increase at most price ranges, but for the moment other price change indicators do not agree.
| |
2019 |
Jul-20 |
% Diff |
| Price Changes |
|
|
|
| Average Sales Price |
$ 2,376,978 |
$ 2,480,642 |
4.4% |
| Median Sales Price |
$ 1,866,666 |
$ 1,970,375 |
5.6% |
| Median Sales Price/ sf |
$ 503 |
$ 504 |
0.2% |
| SP/Assmt Ratio |
1.45 |
1.43 |
-1.0% |
| Market Demand |
|
|
|
| SP/OLP |
89.0% |
92.0% |
3.4% |
| DOM |
149 |
140 |
-6.4% |
So, what are sales prices doing? As I said, if you look just at the average you’d say that prices are up 4.4%, which isn’t bad for 7 months' appreciation. If you look at just the median, then sales prices are up 5.6%. But, if you take a look at the cost per square foot for July 2020 compared to the median for 2019 then prices are only up 0.2% and if you look at the sales price to the tax assessor FMV assessment then we are actually down 1.0%. Throw in the sales price to the original list price which is up 3.4% and the median days on market, which is down 9 days or 6.4% you can get really confused, but it’s not that hard.
The median price is up, and the average price is up, but not as much. This is because, more higher-end houses are selling, but not compared to the very high-end so the median is up, but the average is up a little less. That’s the mix of what’s selling.
Overall prices in 2020 are flat based on price/sf and SP/Assmt ratio. This means we have some motivated buyers and many of the multiple offer deals that are rumored to be high have not closed as yet. At the same time, the market is tightening as the sales price to the original list price is up. Also, the days on market are down so things are a bit tighter. Sellers are pricing their houses better as indicated by the SP/OLP ratio and there is more demand as indicated by the sales price.
Another factor in why prices aren’t increasing yet is that many buyers are looking well beyond Greenwich, not just in New Canaan and Darien, but also in Westchester County and even New Jersey. Our market looks tight inside our borders, but buyers are not coming to Greenwich per se, but fleeing the high density and lack of social distance in NYC. They are looking overall and hence have lots more choices, having said that there are lots more buyers for all the areas that have backyards and amenities. There, as always, Greenwich stacks up pretty well.
While we may not have seen a significant increase in sales price per square foot and sales price to assessment ratio as our 208 contracts close I expect that we will. There is just too much demand and I’m hearing of too many bidding wars for prices not to go up. When you look at the 85 deals that closed in July, 25 of them went for the original list price or more. This percentage is up from 17% for all 2020 deals. Most of the deals that closed in July were signed in the Phase 3 ramp-up period. It will be interesting to see what percentage of deals signed in July go over the list.
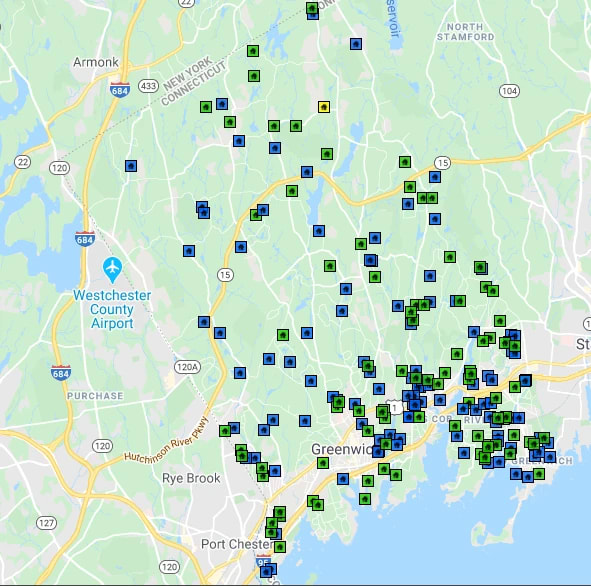
Not only are some price ranges hotter than others, but some areas of town are also hotter. When you look at the market bey school district you can see that our areas with the largest acreage have become the most popular. Our two most northerly school districts are where the action is. North St and Parkway elementary school districts are in a tie for the largest percentage of transactions with 96 sales and transactions each. As they used to say in elementary school, Parkway is the “most improved” in the Covid era with transactions up a third from 15.5% pre-Covid to 20.4% in the Covid era.
| Elem. School |
Sold |
Pending |
Contngt |
Total |
Post Covid % |
Pre-Covid % |
Diff |
| North Street |
58 |
24 |
14 |
96 |
20.4% |
21.4% |
-0.9% |
| Parkway |
46 |
36 |
14 |
96 |
20.4% |
15.5% |
4.9% |
| Riverside |
45 |
11 |
13 |
69 |
14.7% |
11.7% |
3.0% |
| Glenville |
25 |
11 |
5 |
41 |
8.7% |
10.7% |
-2.0% |
| Old Greenwich |
27 |
9 |
6 |
42 |
8.9% |
9.7% |
-0.8% |
| North Mianus |
28 |
5 |
8 |
41 |
8.7% |
7.8% |
1.0% |
| Julian Curtiss |
12 |
6 |
13 |
31 |
6.6% |
6.8% |
-0.2% |
| Cos Cob |
10 |
7 |
7 |
24 |
5.1% |
11.7% |
-6.5% |
| Dundee |
7 |
4 |
3 |
14 |
3.0% |
1.9% |
1.0% |
| New Lebanon |
1 |
4 |
5 |
10 |
2.1% |
2.9% |
-0.8% |
| Hamilton Avenue |
2 |
1 |
2 |
5 |
1.1% |
0.0% |
1.1% |
| Grand Total |
262 |
118 |
90 |
470 |
|
|
|
School Districts in the Covid Era – Sales, Contract – 2020 Covid Era % vs Pre Covid %
Riverside Elementary School District has also seen a significant increase in transactions in the Covid part of this year, while Cos Cob has seen the biggest decrease. This doesn’t mean that Cos Cob School District sales are down compared to 2019, they are not only that there has been a shift in the post-April 2020 sale percentage to Parkway and Riverside.
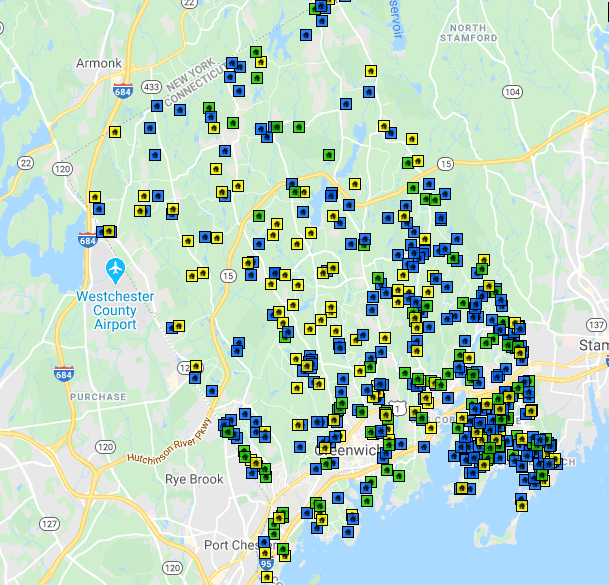
2020 Pre-Covid vs Covid-Era Sales and Contracts
When you combine the two most northerly school districts with Riverside you have more than half the deals in town. Does this mean we are going to see more crowded schools; possibly? What isn’t clear is how many of these families have school-age kids that will be going to public school. And, in some cases, a family with school-age kids may just be replacing a family with school-age kids so there is no net increase in students. Also, Parkway and North St have additional capacity, but Riverside which already has our largest elementary population and possibly Central Middle School may see some expanded enrollment.
After years of a shrinking, to flat population having a few more people in town will be a good thing, particularly if everyone has electricity.