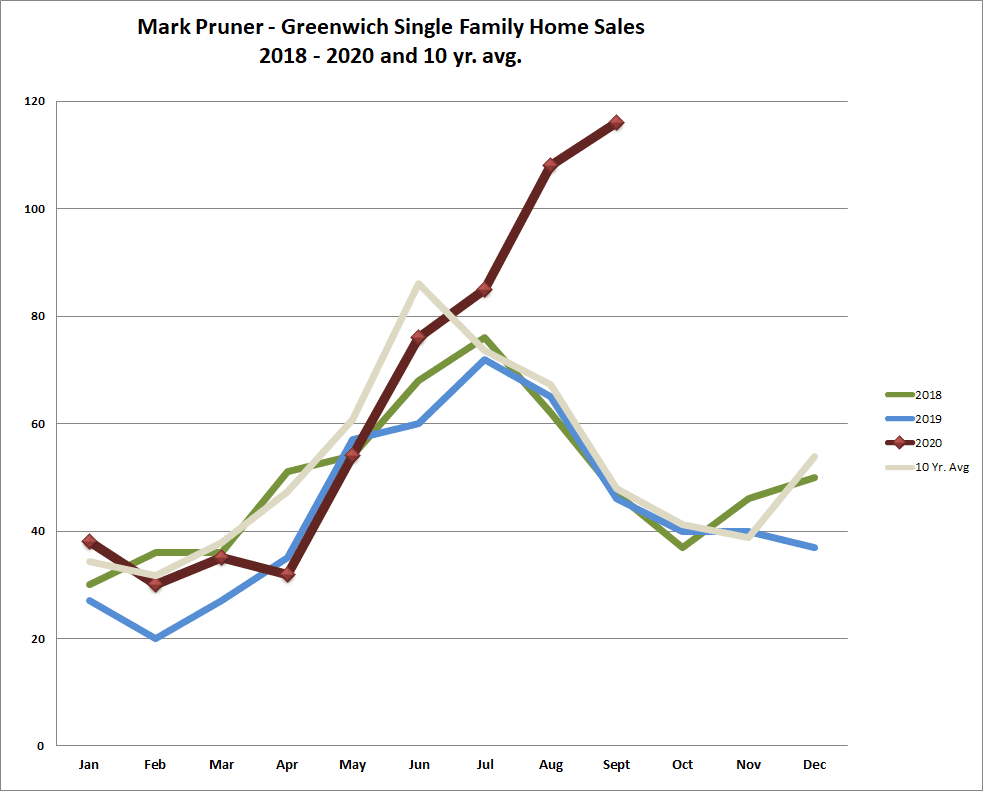
October Mid-Month Update
We have sold 52 homes through October 16, 2020. Our 10-year average for the whole month of September is only 49 houses. So, we have already sold more in half a month than we normally sell in the whole month of October. We also have 178 contracts so once again we have a good chance of having over 100 sales for the month and have record sales for October.
If you add the 173 contracts that we have signed now to our 577 sales, we have had in the first nine months you come up with 747 sales for the year. This would be our highest number of sales in the 21st century. What’s even more amazing is that the 4th quarter generally is only 21% of our sales. It will be much more this year.
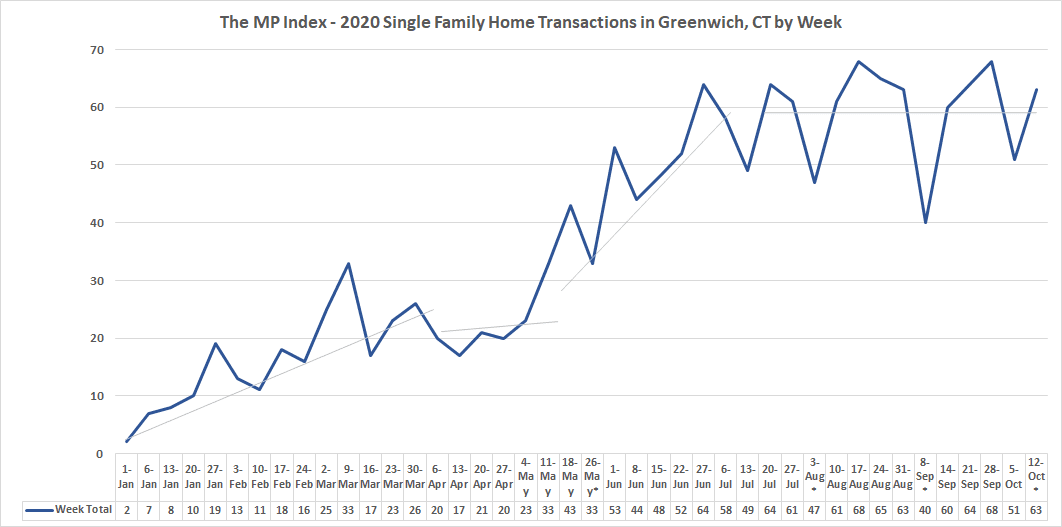
When you look at our sales and contracts for the last three months by week, the weekly transactions zig-zag, but even the low points are at a higher level than we saw in the first half of the year.
Total 2020 Greenwich House Sales and Contracts by Week
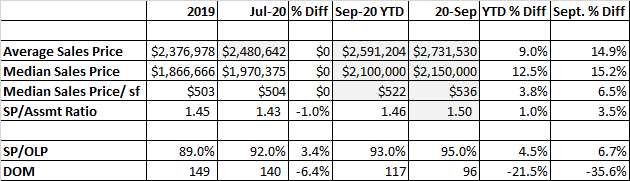
Our totals are all looking good with our average and median sales prices up 9.0% and 12.5% respectively compared to year-end 2019. When you look just at 116 September sales, our average and median prices are up even more as you would expect in an accelerating market.
On the inventory side, we are down at just about every price level. Our prices are up and so are our sales and contracts.
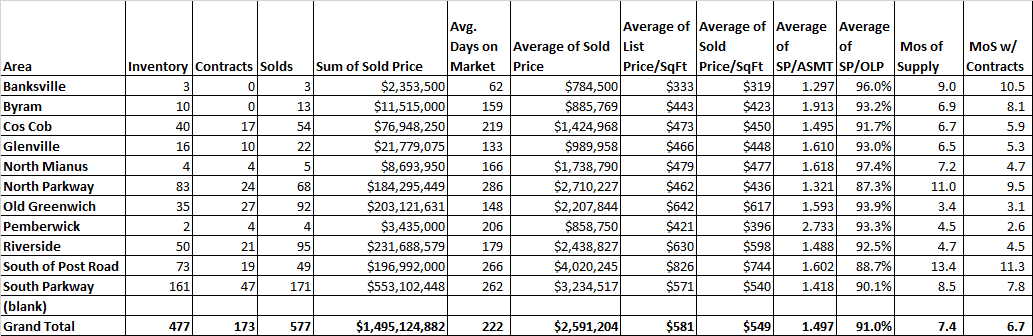
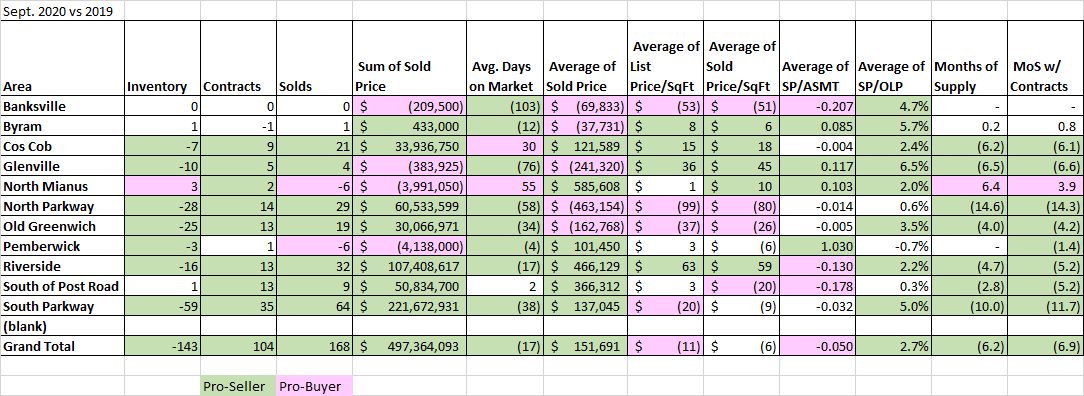
September 2020 YTD Neighborhood Report
Looking at just these numbers you would think that everything, townwide is rosy. If, however, you look at the individual neighborhoods in Greenwich, you see more nuanced stories. Some neighborhoods are down in some categories and some neighborhoods are doing remarkably well compared to last year, but they still have a ways to go.
When you look at the neighborhoods, certain areas and numbers jump out. Backcountry and mid-country are doing very well this year, while Byram, Pemberwick, Banksville, and North Mianus are not doing much better and in some statistical categories are actually doing worse. The one factor that ties all this together is acreage. If you have bigger lots in the pandemic year of 2020, you are doing better. If you have less acreage per lot, the demand has not increased much this year.
Backcountry
One of our hottest areas has been backcountry where sales are up 74% for the year. Our contracts are up an amazing 140% this year. We have sold 68 houses and have 24 under contract. While this is a remarkable turnaround this year in many ways, all this gain has just gotten backcountry back to even. When you look at the inventory of 83 houses compared to the sales of 68 houses you come up with 11.0 months of supply. The second highest for any neighborhood. Add in the 24 contracts and things look a little better with 9.5 months of supply which is down by 14 months of supply from last year.
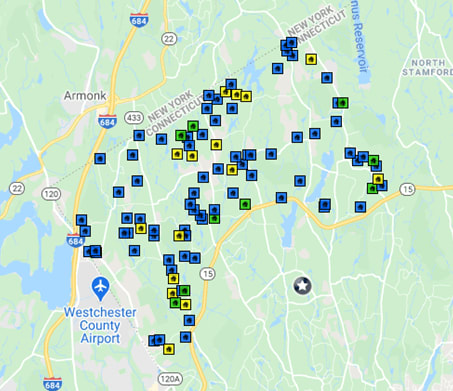
Backcountry Sales 2020 (as of 10/17/20)
Sold (Blue) 73
Pending (Yellow) 16
Contingent Contract (Green) 9
This increase in backcountry sales actually started in 2019 when backcountry sales for 2019 were up 30% compared to 2018 (which tells you just how bad things had gotten in the backcountry by 2018). The other big change is where the sales and contracts are in the backcountry. In short, they are everywhere, which is a change from prior years. In 2018 and before, the further you went out in the backcountry the harder it was to sell. Now, the backcountry is backcountry. Sales are spread throughout the 4-acre zone and there is even a concentration along the north border as folks from Westchester want to escape the harsh impact of the $10,000 SALT cap on taxes, but still want to be close to their friends in Armonk and Bedford.
Mid-Country
The area that has done the best in 2020 is mid-country or South of the Parkway as the Greenwich MLS calls it. Their sales are up 60% less than backcountry’s 74% increase, but contracts in mid-country are up an incredible 292% to 35 contracts compared to only 12 contracts in 2019. We also have 8.9 months of supply, the type of number you used to see some years for Riverside. Total sales in mid-country are $553 million or up $221 million from 2019.
Also, in mid-country, the average sales price is up $137,045 while the average sales price in the backcountry is down this year. Neither of these numbers is particularly indicative of what individual house prices are doing. They indicate more higher-end houses are selling in mid-country and more houses below the backcountry average north of the Merritt. The changes in the mix of what is sold are causing these numbers to jump around.
For a better indication of how individual house values are doing, look at the price/SF and also the ratio of this year’s sales prices to the 2015 assessment values. These numbers are less affected by what price points are selling. When you do that, you see that both these numbers are actually down a little bit. What we are seeing are lots of motivated sellers meeting the bids of even more motivated buyers. Once this group of sellers who have been waiting to sell is used up, then you will see more bidding wars and prices going up. Of course, this assumes that a couple of trillion dollars of new government debt and continuing high unemployment don’t lead to a recession next year. So far average and median prices are moving up. In September, both the average and median sales prices were up compared to those numbers for the whole year of 2020.
Riverside, Cos Cob & Old Greenwich
These three neighborhoods in the southeast part of town have traditionally been our family neighborhoods and as such, they have done very well this year. We have lots of families that have been cooped in small apartments in NYC with some very restless kids who are buying up houses left and right in these neighborhoods. Old Greenwich has 3.4 months of supply which is the very definition of combat buying. If you are a buyer, you need to be all cash or have a mortgage application that is underwritten and pre-approved, because you are not going to be the only people interested in the houses that are properly priced.
In Riverside, it’s not tooth and claw, but it is still hot with only 4.7 months of supply, so be prepared. Cos Cob is actually at 6.7 months of supply, but this is down from 12.8 months of supply at this time last year; 2019 was not a good year for Cos Cob, but 2020 is.
Glenville
Glenville has been much like Cos Cob and has done better than its southerly neighbors, Pemberwick and Byram. Glenville has an inventory of 16 houses and has already sold 22 houses with another 10 under contract. This equates to 6.5 months of supply for sold houses and drops to 5.3 houses when you add in the contracts.
Glenville also has the greatest increase in sales price/sf at 11.1%. We are seeing some real property value increases in this area. You wouldn’t know this however if you looked at the average sales price which is down 19.6%, This is the kind of jump that you see where you have less than two dozen sales and the loss of a couple of high-end sales while also having a couple of more sales under the average. So, all the Glenvillians should focus on price/sf and ignore the averages.
Pemberwick & Byram
The market is not bad in Pemberwick and Byram, it just didn’t get any hotter this year. The irritating thing about these two areas for us Realtors is that people who move in really like it and tend to stay here so from year to year we don’t have a lot to sell. Right now, we have 2 houses on the market in Pemberwick and 10 houses on the market in Byram.
With 4 sales in Pemberwick, we are looking at 4.5 months of supply, which is just the same as we had last year. It’s still hot, it just didn’t get hotter. Part of this may be that buyers who are fleeing New York City are looking at smaller lots and options throughout Westchester and Fairfield Counties. This can not be said of buyers looking for 2 and 4-acre lots, as many towns don’t have large lot zones.
Byram has had 13 sales this year which equates to 6.9 months of supply, essentially the same as last year’s 6.8 months of supply. Both the average price/sf and the sales price to assessment ratio are up slightly in Byram.
Summary
Our market took off in June and has risen to levels of demand hardly ever rarely seen in the last 40 years. We are quickly working our way through our shadow inventory (a term I never understood, but Halloween is this month, and I’ve always wanted to use it). Once most of the folks that have been waiting to move up, move out, or downsize have done so, we are going to see an even tighter market.
Right now, we really need inventory to meet our demand; not something you normally say in October. If you do list now, however, trying the premium price route may well not be effective. You’ll get showings but if you do get offers, they may not be what you want. On the flip side, if you price your house to this market, you have a very good chance of having a contract before year-end even with the holidays coming up.