Are You the Doughnut or the Hole?
Greenwich single-family home sales dropped 21% in October compared to September 2020. Some people will see this as the beginning of a return to our typical winter doldrums for sales. But, that’s not very likely to happen, since we have 182 contracts waiting to close. What you want to focus on in October sales is the doughnut and not the hole.
October Sales are the Doughnut with Extra Sprinkles
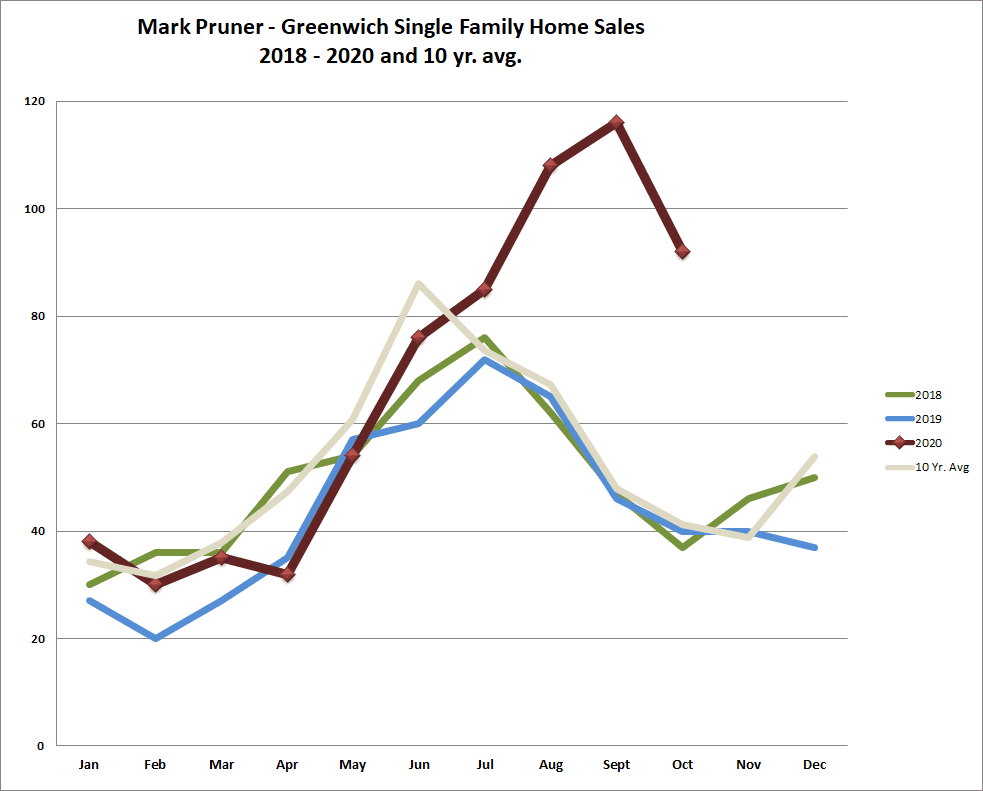
Our 92 sales in October are spectacular. Our ten-year average for October is 41 sales, we more than doubled that number this year. Our 92 October sales are actually higher than our average for our best sales month, June, which only averages 86 sales. So good sales, but a significant drop over last month, but very good contracts.
A significant part of the drop in sales in October compared to September is likely the uncertainty of the election. Whenever there is a rise in uncertainty, we see a slowing in sales. I’ve always found this curious, as closing dates are set weeks and months before the event, but as the event draws nearer, closing dates get pushed beyond the uncertainty created by the event.
Contracts Continue to be Way Up
With 182 contracts we actually have a good shot at November being over 100 single-family home sales, which would be a rebound from October. The one thing that the drop in October likely means is that we won’t make 900 sales this year, but over 800 sales are likely as we have 853 sales and contracts total YTD. This compares to 526 sales for all of 2019.
Now 2019 was our worst year since the crash of 2009. Our 671 sales in 10 months are greater than our 10-year average of 621 sales per year, and we have two months to go. Our market has been like those movies, Chariots of Fire, The Black Stallion, Herbie the Love Bug, et al where the competitor stumbles and then comes roaring back. February to April was all below-average months so to have already exceeded our 10-year average shows just how strong the second-half sales surge has been.
Months of Supply are Way Down
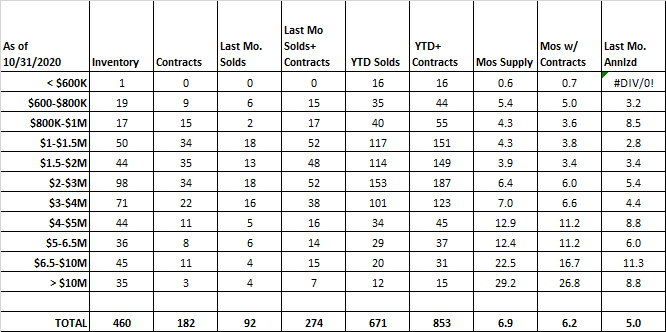
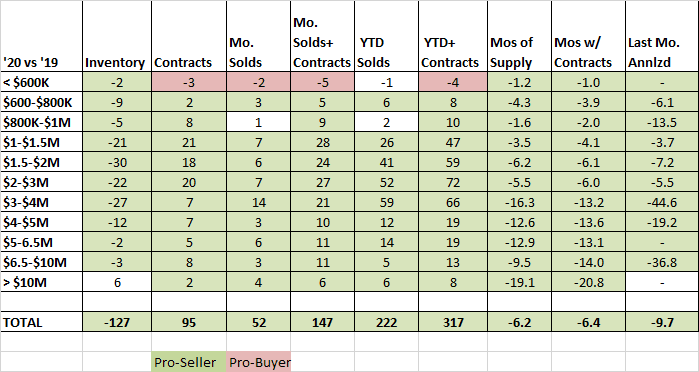
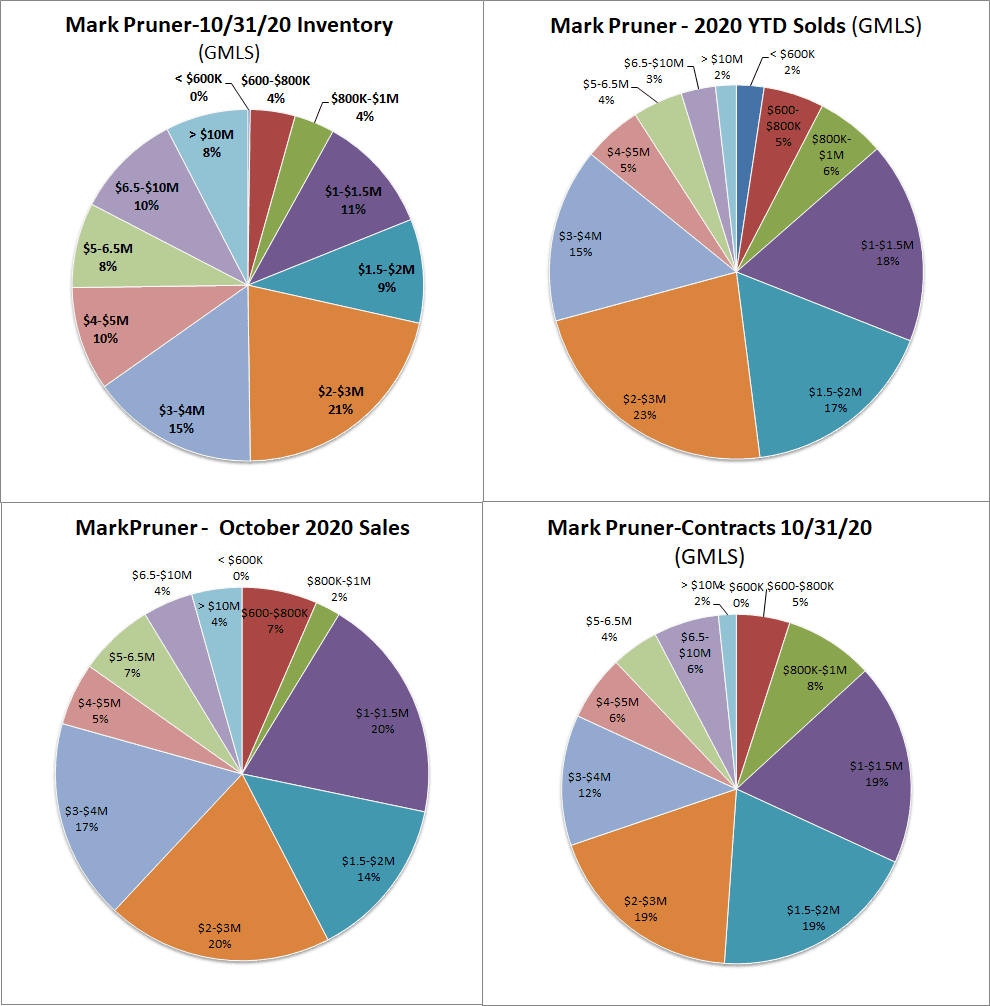
When it comes to parsing the numbers this month it’s actually kind of boring. Our inventory is down 127 houses or 22% from last year in every price category, but one. The one exception is over $10 million where we are up 6 houses from 29 to 35 listings. At the same time, we are up 100% in sales at the ultra-high-end from 6 sales last year to 12 sales this year, and half of those sales are over $16 million. This brings up our average for the year to $2.67 million up 12.5% from last year. Our median sales price is also up 12.8% to $2.11 million.
October saw our sales price per square foot increase by 4.7% compared to all of 2019. This is a much better indicator as to whether house prices are rising as it is less influenced by whether sales are up in any particular price category. At the same time, our sales price to assessment ratio is only up 1.7% for the first 10 months of the year. When you look at just October sales, those sales prices to assessment ratios are up 4.1% over last year. These are real price increases in Greenwich house prices regardless of how you look at it. You just need to pick your number depending on whether you are talking to someone from Darien or the Tax Assessor.
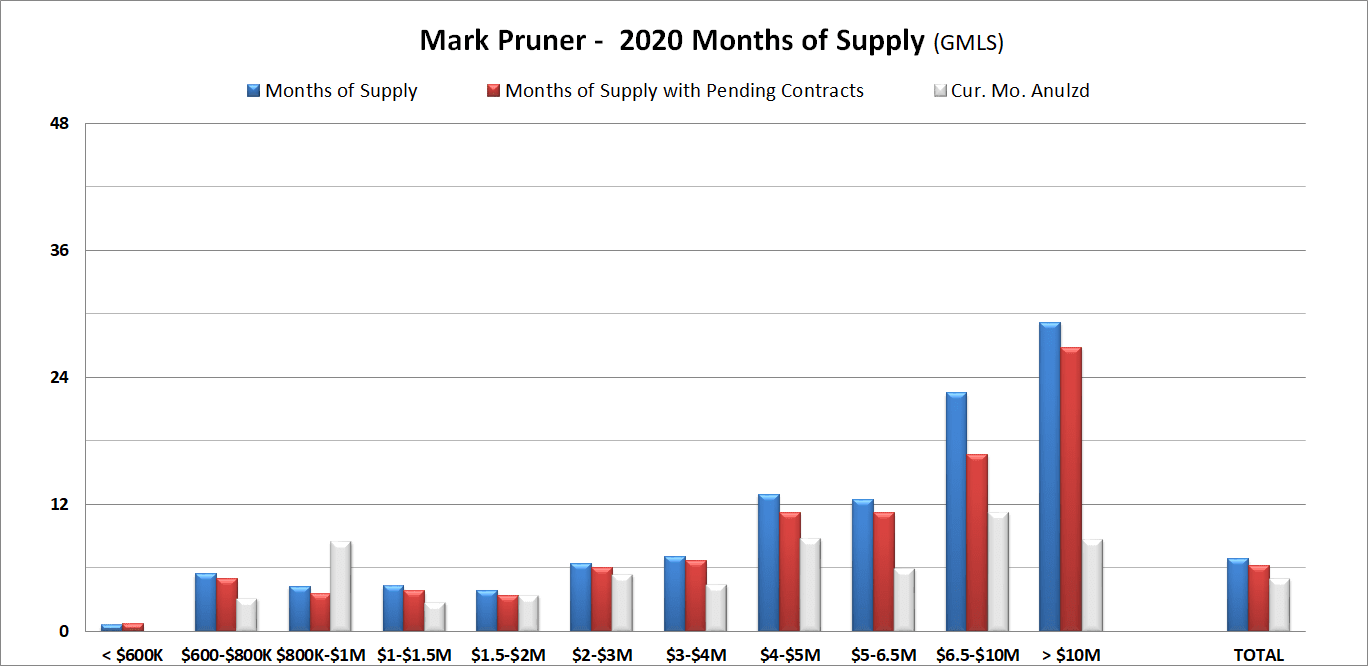
What is really remarkable across the board is our drop in months of supply, which is the amount of time it would take to sell our present inventory based on the rate of sales so far. With inventory down 22% and sales up 49%, months of supply for the whole market is down from 13.1 MoS to 6.9 MoS. This is a big drop and means for most price categories we are clearly in a seller’s market.
Over $10 million, we are down from 48.3 months of supply to 29.2 MoS, a drop of 19.1 MoS. The next biggest price category MoS drop is somewhat surprising. From $3 – 4 million, we are down from 23.3 MoS last year to 7.0 months of supply this year, a drop of 16.3 MoS. (If anyone is looking in that price range, I have a good backcountry opportunity for you.)
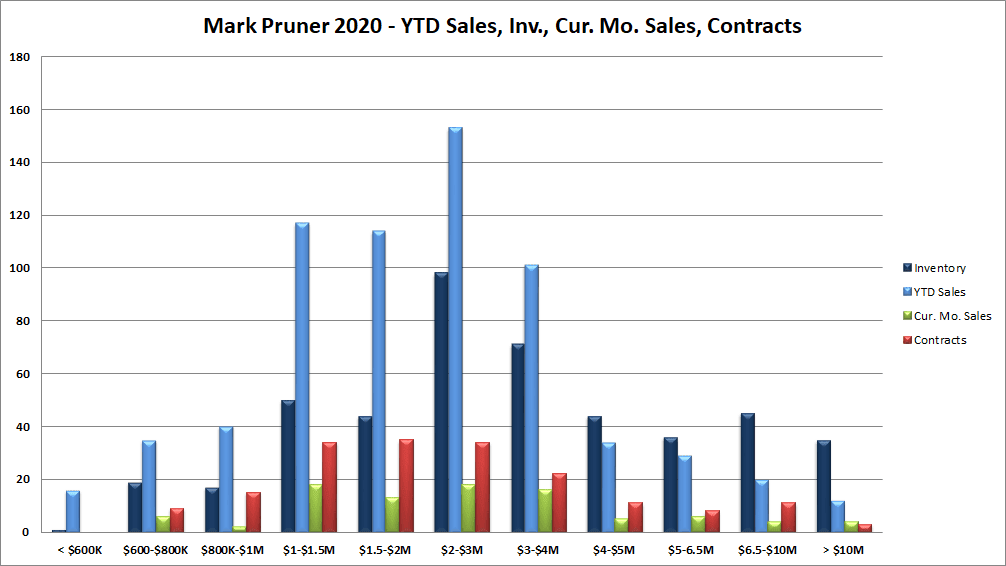
When you look at the bar chart of inventory, sales, last month's sales, and contracts a few things jump out at you. Our $2 – 4 million market is doing particularly well for sales. It’s also where we have the most inventory, so it is not supplied constrained like our under $1 million market. The hot area for contracts is $1 million to $4 million and we saw the same thing for sales last month.
Should I Stay or Should I Re-Lo?
In every other post-recession year, when a client would ask me if they should list their house in November, it was a nuanced investigation to look at inventory, sales, style of the house, age, and condition. I don’t like to put on houses when inventory is high and demand is low, to have them sit accumulating days on market. Often my recommendation was to wait until late February of the following year. In 2020 this analysis is not necessary. The analysis is not what month and year you should put your house on, but how soon you can put it on this year. The buyers are there, and many are looking for fresh inventory. Speed is probably to your advantage unless you want to roll the dice for the potential of a little more appreciation versus the potential for a bigger depreciation.
For buyers, you should be ready to move quickly when you find the right house. If you don’t there is a good chance that someone else will.
And then there is the whole question of what this election will mean for Greenwich real estate.