

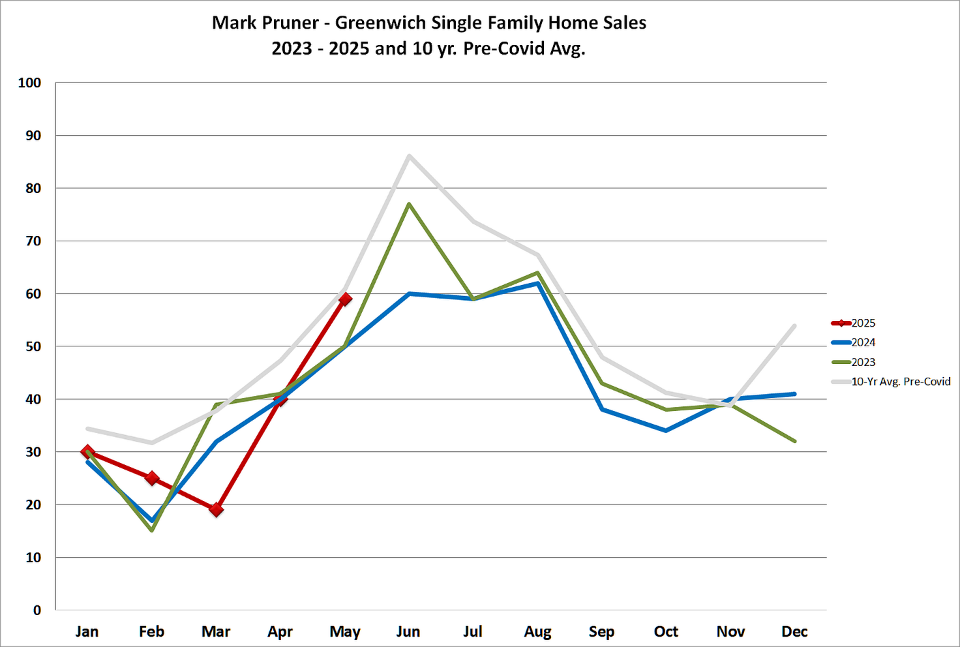
Greenwich single family home sales continued to climb like a SpaceX rocket in May 2024. The question is will sales crash like a SpaceX Starship, when the second stage kicks in. Last month, we had 59 single family home sales, the most May sales since the Covid years and before that you have to go all the way back to 2015 to find a better May.
With stock prices recovering in the month of May, buyers decided it was time to close, before their stock values fell again like they did in the March when Greenwich house sales cratered to their second worst March this century. When stock prices recovered in the last 10 days of the April, delayed closings happened quickly. (See my April report for an illustration of how the Greenwich buyers are influenced by stock prices.)
May 2025 sales continued this pattern of quick buyers closing as sales numbers increased at a rate higher than normal. In two months, we went from a horrible March to a May that just about matched our 10-year average, when we had been well below average all year and for most of the past two years.
What’s really remarkable about the May jump in sales is that we did it with inventory way down. Our inventory is 81% lower than in 2019. This lower inventory has been consistent all this year with every week setting a new record low for that week. Having a sales number that matches our historic average with only 19% of the inventory that we had had in prior years is astounding.
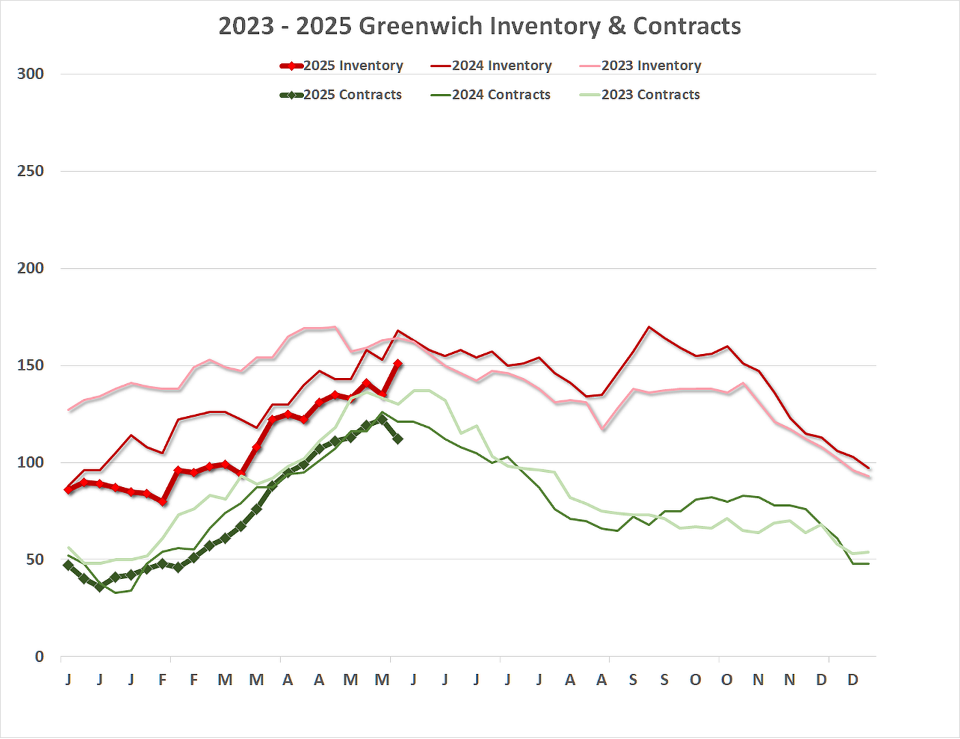
Can we keep up this pace of sales? Do we have enough fuel for that second stage of the rocket? The answer is not clear. Our inventory has climbed steadily since March, as it is supposed to do in the spring market. (It’s also supposed to grow in January and February, albeit more slowly than in the spring market and it didn’t really do that this year.) Last week our inventory took a big jump from 135 listings to 151 listings, our highest number of listings so far this year. We’re hoping this is the beginning of a surge of new listings coming to market.
But is that one week jump in inventory significant? For you contrarians out there, you can also argue that the big jump last week was due to Memorial Day two weeks ago when we saw an actual drop in inventory. If you average the 5 new listings during Memorial Day week with the 18 new listings last week, you get a much less inspiring 12 new listings average for the last two weeks. Only time will tell whether our inventory will continue to rise this year. Outside the northeast we are seeing rising inventories, some in excess of 2019 levels and several markets are seeing falling prices. That’s not what is happening in Greenwich.
As the Chinese saying goes, “May you live in interesting times.” So now comes the interesting times. More inventory in May led to more sales, but the rocket jump in sales was aided by a lot of contracts closing. As a result, the number of contracts, which should be growing, took its largest weekly drop in the last couple of years. What will happen in June, which is traditionally our biggest month for sales? Our 10-year average for June sales is 86 single-family home sales. What are the chances of us getting there this year?
The last two months sales have jumped about 20 sales per month, which would get us to 79 sales, not too far from our 86 sales average for June. To continue our sales pace, we would need to get 79 sales out of our present 112 contracts and out of new listings that close in the same month they come on. In April 2024, we got 40 sales out of our 111 contracts. To make it to 79 sales we would need a bunch of quick closes or an even bigger drop in contracts than we saw this month. This would slow July sales, traditionally our second biggest month for sales.
In May 2025, we burned a lot of rocket fuel, i.e. contracts to get to our 59 May sales and we will need a bunch of even quicker closes to get to 79 sales in June 2025. If we do get to 79 sales in June, it will be our best June since 2016 except for the record Covid year of 2021.
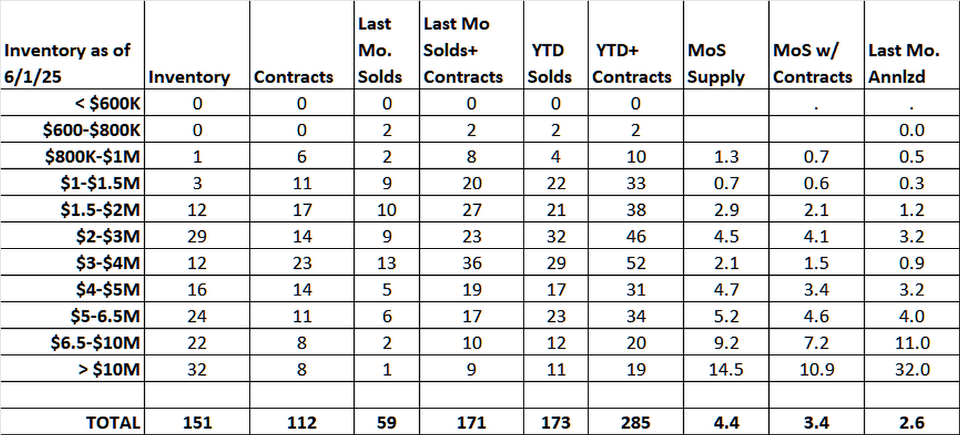
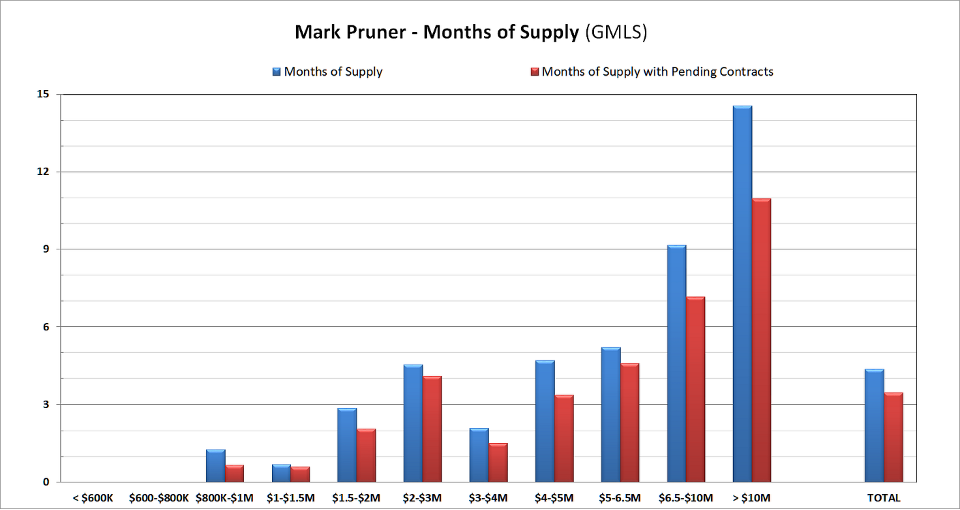
Higher number of sales is not only the big statistic for May. Just about every other statistic is pointing to a hot and tight market. Our months of supply is down from last year and below 6 months all the way up to $6.5 million. When you add in our contracts, months of supply shows a tightening market in every price category. Contract month of supply shows the greatest tightening is in the price ranges above $6.5 million.
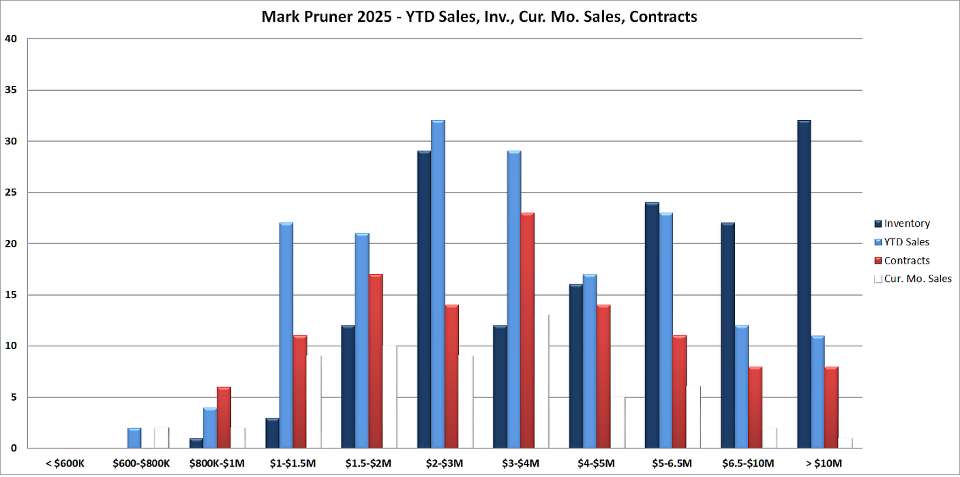
Our overall Inventory is down 10.7% from 2024. All the price ranges below $4 million are down. Below $1.5 million, I can show you every house on the market in less than 90 minutes, as I only have 4 houses to show you (as my brother Russ pointed out in our office meeting this morning). While our contracts are down, this is because a lot of people closed quickly in May when stock prices stayed up.
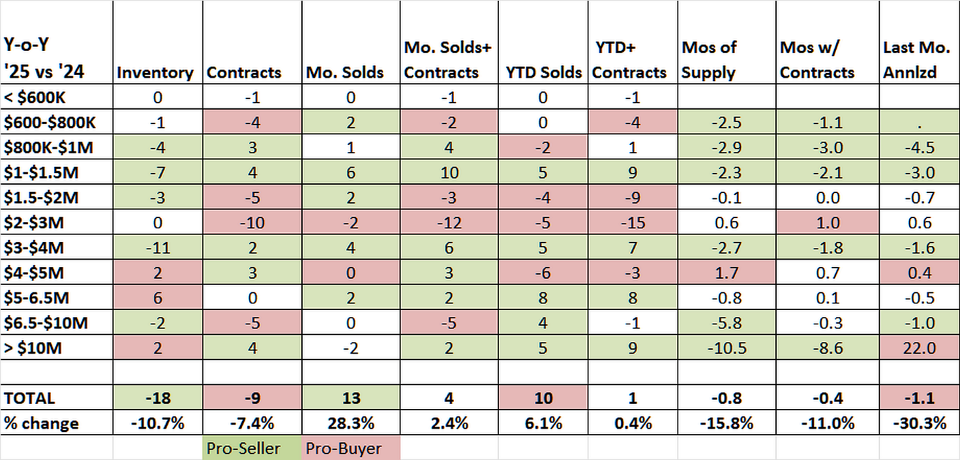
We do see an increase in inventory over $4 million and over $5 million inventory is up a lot. More high-end inventory along with more high-end demand means sales are up. In 2025 our high-end sales, over $5 million are up 59% from 29 sales in 2024 to 46 sales so far this year. Ultra- ultra-high-end sales are up in markets across the country.
Our Greenwich Streets Team here at Compass still has the highest sale and contract price this year at $21 million. We do have 10 houses listed above that price, but only 2 of those 10 houses have been on for less than 60 days on market. As we saw in our sale, the high-end buyers are out there and one of these houses is likely to sell for more than $21 million, but it’s nice to have the highest sale at least for the first half of the year.
The statistic that most people ask me about is also up. Our sales price is up 10.3% over last year. At the end of this May our YTD median price is $3,200,000 compared to $2,900,000 in May of last year. However, it’s not likely that your house is up 10.3% from last year.
About half of that median price increase is due to changes in the mix of what is selling. We have little inventory under $1.5 million while over $5 million we’ve seen a 59% jump in sales. These two factors play a big part in the 10.3% median sales price increase. A better number to look at is price per square foot. This stat is less affected by the mix of what is selling. Our Greenwich price/sf is up 4.5% from $758/sf last year to $792 this year, still a nice increase off an already high base, but not double digits.
In our other stats showing a continuing hot market; our median days on market last year was a ridiculously low 26 days and in 2025, it’s a slightly more ridiculous 24 days. Of our 59 sales last month, 35% went for over list and another 20% went for full list price for a total of 55% selling at full list price or over. This is just a bit higher than last year when 54% of 2024 sales went for full list price or over.
However, you look at the market is tight and will continue to be so. We have lots of buyers for the pittance of inventory that we have. The consensus at our Compass office meeting this week is that given all the economic uncertainty, the persistent higher interest rates and a flat to down stock market, buyers are more cautious. However, if you are buyer, you are not really going to notice it as we still have plenty of buyers for the record low inventory that we do have.
Buyers need to be prepared to either do some work to fix up a house or wait for “their” house and then move quickly. For sellers, it’s a good time to list.
Mark Pruner is a principal in the Greenwich Streets Team at Compass Connecticut. He can be reached at 203-817-2871 or at mark.pruner@compass.com.