Inventory at Record Lows
Overview
Greenwich Home Sales up 44% to New Record
Greenwich just had an all-time record third quarter with 319 sales which are higher even than the prior record in the Covid-driven third quarter of 2020. For the first 9 months, we saw 832 homes sold, up 44% over 2020, the prior record 9 months. Those 832 sales are more than a full year’s sales for any year, but 2 of the last 22 years.
Value of Sales up Almost $1 Billion
Our total sales volume for the first nine months of 2021 increased by almost $1 billion from last year’s $1.495 billion sales to this year’s $2.478 billion, or an increase of $983 million. Last year's total sales volume for the entire year of 2020 was $2.300 billion, so we are already $178 million ahead of total sales for last year, with 3 more months to go in the year.
All While Inventory Was Low
Our inventory has been low all year as houses priced right went to contract almost as quickly as they came on. We had 993 new listings, which fueled our record sales in the first 9 months. Our sales are slowing down as listings are coming on at a slower rate. Our shadow inventory of people who had waited years to sell is gone, but luckily, we are getting listings from lots of upsizers in Greenwich selling their “smaller” houses.
WOOFH Driving Sales More Than Covid
Once vaccines became available in the first quarter, you might have expected sales to decrease, but this didn’t happen. In the second and third quarters, WOOFH (Working Occasionally or Often From Home) has been a major factor driving the market. While NYC is not getting any closer, the time spent commuting is shrinking, often down 60% to 100% for Greenwich buyers as people don’t have to go into offices as frequently or at all.
Sales Over $5 Million up 265% In Two Years
Our over $5 million sales have increased 91% over last year. Our over $5 million sales are up a huge 265% in the last 2 years from 35 sales YTD in 2019 to 128 sales in 2021. Off-market sales are also very busy, many of which are high-end, private sales, but are hard to calculate, as these are not tracked well.
The Greenwich rental market for single-family homes is even hotter than the single-family home market as many people want to “try-out” Greenwich and still aren’t certain about how often they will have to go to work.
Third Quarter Greenwich SFH Sales and First 9 Months
The first nine months of 2021 were an all-time record for Greenwich with 832 sales. The previous 9-month record was only 655 sales in 1999. Since 2021 isn’t over yet, 2020 is still the all-time record holder for annual sales with 863 sales, but 2021 will surpass that as we have 101 contracts waiting to close.
To see how really remarkable the first 9 months of 2021 have been just looked at the first 9 months of 2020 where there were only 579 a far cry from the 832 sales in the first 9 months of 2021. (It really was the last quarter of 2020 that made it a record-setting year. We will have trouble matching it this year unless we get a lot more new listings. As a result, expect to see a bunch of headlines in the fourth quarter about sales being down in Greenwich, when they are still well above our 10-year average.
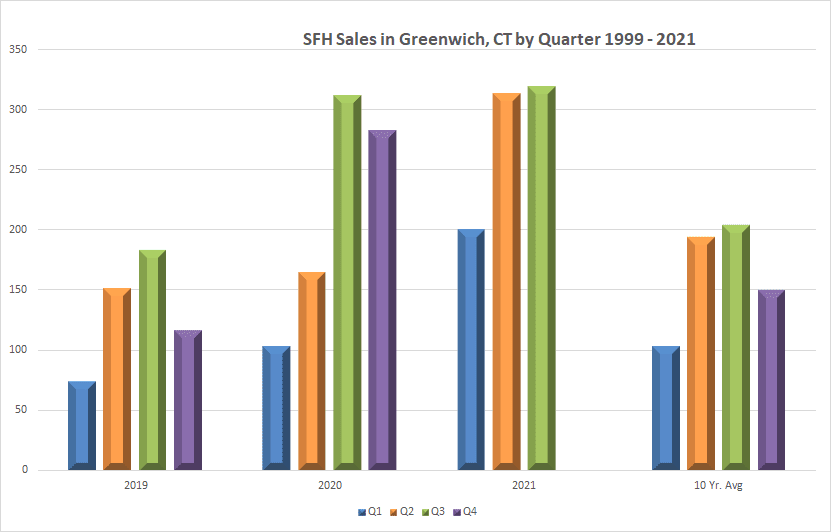
As to the third quarter itself, in 2021 we had 319 sales with only last year’s third quarter even coming close at 311 sales. Prior to 2020, the previous record was 273 sales a couple of decades ago in 1999. In fact, every quarter in 2021 was the highest sales quarter ever in Greenwich. This led to the first 9 months of sales of 2021 breaking the previous record first nine months of 1999 by double digits, 27% higher.
Sales by Months: The Ups and Downs of 2021
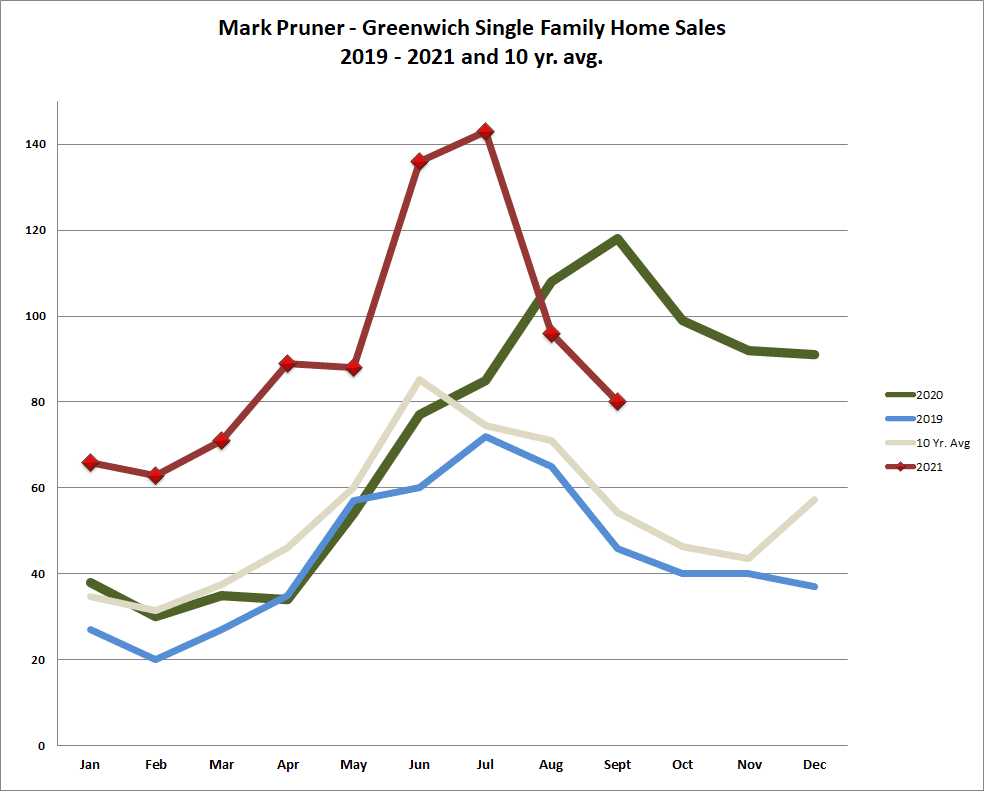
For the month of September 2021, we had 80 sales which are 47% above our 10-year average of 54 sales. However, this year’s sales are down 31% from September 2020 sales of 118 houses, which doesn’t sound good. However, September 2020 was the all-time highest month’s sales of any month until this year. But for the record sales in September 2020, this September would have been the record for the month of September.
You have to be particularly careful of year-over-year comparisons for the rest of the year as the 4th quarter of 2020 was outstanding, so a drop in sales from last year doesn’t mean that we didn’t have a good sales month. Sales will likely be down from 2021 for October, November, and December, but they still may be well above our 10-year average indicating a good to very good month just not a record month.
Factors for the jump in sales include people getting vaccinated and feeling more comfortable looking for houses and on the flip side, owners getting vaccinated and being more comfortable with strangers in their house. WOOFH is also making for much less weekly commuting time. As a result, buyers who might have been daunted by a 10 – 15-hour weekly commute, may find 4 – 6-hours weekly commuting very doable.
Another factor driving our peak sales months in June and July could be expiring 12-month leases that were signed last spring and summer at the height of Covid fear. We also had a huge number of summer rentals in 2020, many of which were extended as tenants didn’t want to go back for the accurately predicted fall and winter infection surge as people spent more time indoors. As these leases expired, many tenants decided that Greenwich was the place for them to buy.
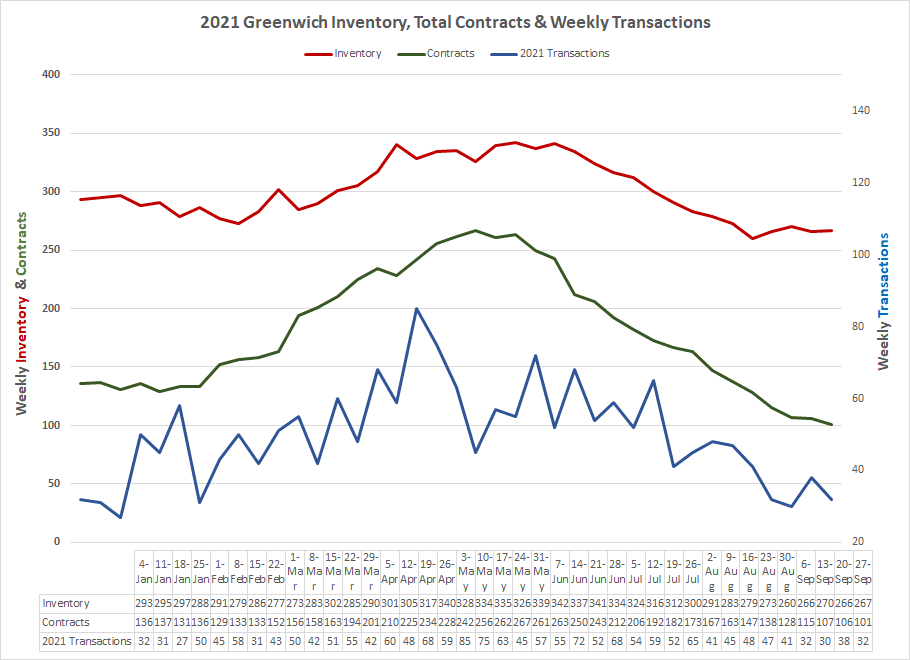
Contracts, Inventory, and Transactions All Dropping and for the Same Reason
Transactions, which are contracts plus sales, had been trending up for the first half of the year, and then took a sharp jump in the first week of May. Our weekly average in 2021 in 28 transactions per week, but in the first week in May, we jumped to 57 transactions followed by 54 transactions the next week. These 111 transactions represent 13.3% of our 832 sales YTD and happened in just those two weeks. Personally, I’ve been calling that period The Frenzy as it was continual showings, contract negotiations, and working with inspectors, appraisers, bankers, and attorneys to get deals done.
During the Frenzy, we actually saw listings tick up a little bit as April and May were when we saw our most new listings. This is unusual as we normally get lots of new inventory in February and March. This year, many listings were delayed, partly Covid and partly weather-related. We also saw owners who had rented their houses to folks getting out of NYC, listing their houses after the one-year lease was up.
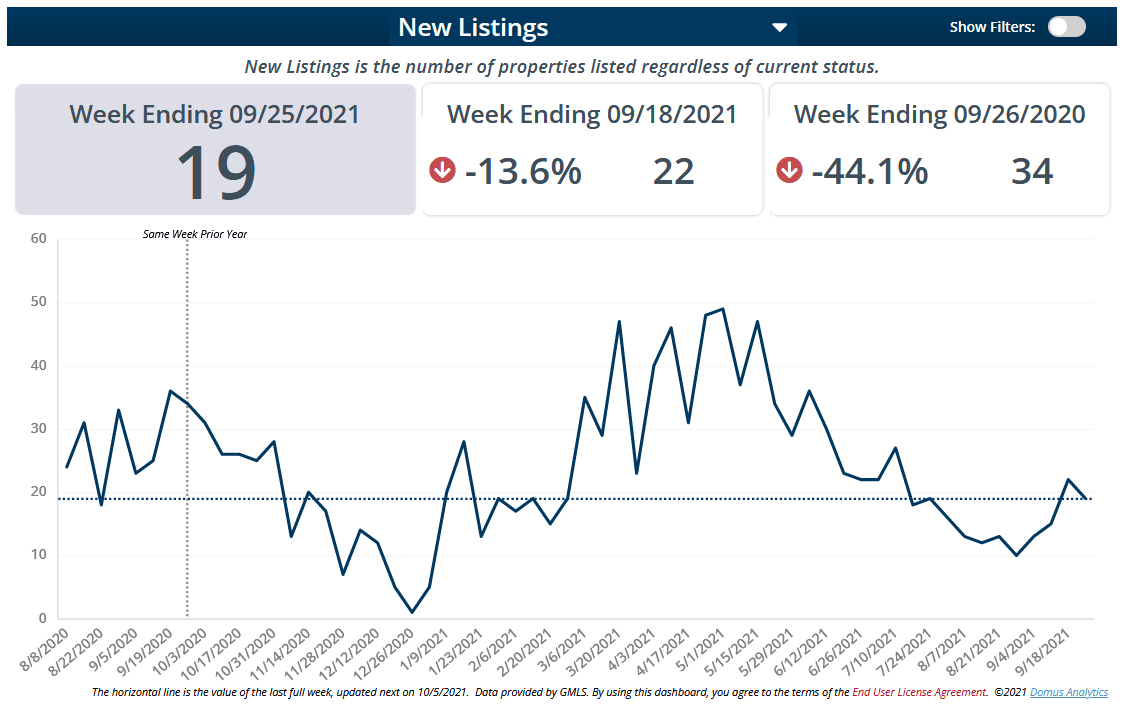
The last few weeks have not been good for new listings with a much smaller number of houses coming on than we normally see in our fall market, which starts right after Labor Day. Post-Labor Day we got just above 20 listings per week, but with an equal number of houses going to contract, the best we could do was to keep inventory flat.
The problem is that this stabilization is at very low numbers. Just before Labor Day, we reached an all-time low in inventory with only 260 listings. Last year in a hot market, we had 477 listings at the beginning of October 2020 and in October 2019 we had 622 listings or 140% more choices for buyers 2019. Once again when comparing numbers, you have to be careful of the base. We weren’t having a great market in 2019, a more average number would be 550 listings for the fall market, but anyway you look at it our listings are way down in 2021’s fall market.
The low number of new listings leads to a dropping level of inventory, which leads to reduced sales and that is what we are seeing now. September 2021 sales were a very good month historically, but well down from the all-time high in July of this year. If we had had more inventory, we would have had more sales, the buyers are out there.
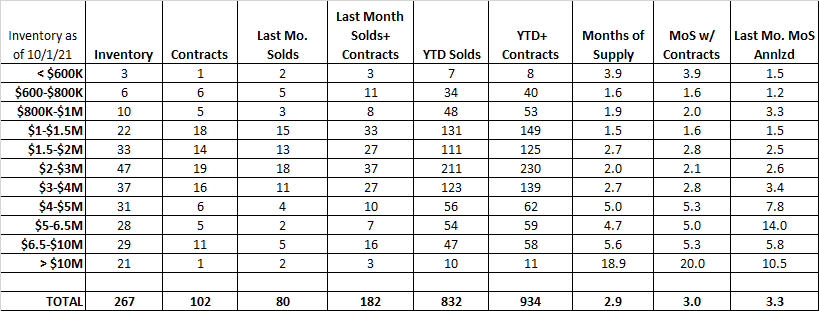
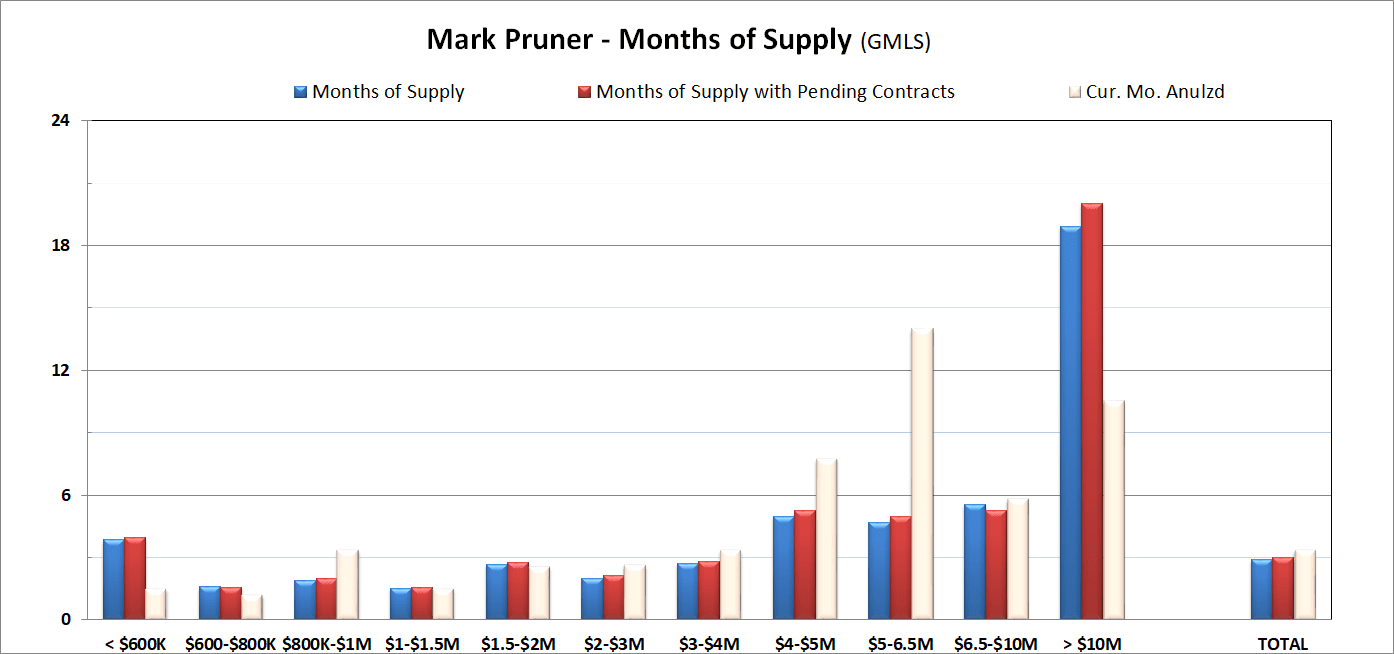
Our low inventory and high demand make for some incredibly low months of supply. We have less than 3 months of supply from $600,000 all the way up to $3 million dollars indicating a very tight market since anything below 6 months of supply is considered a seller’s market. Even more incredible is that we have less than 6 months of supply all the way up to $10 million. These are price ranges that used to be measured in years of supply. Our market continues to be a very hot market, just not as hot as during the Frenzy.
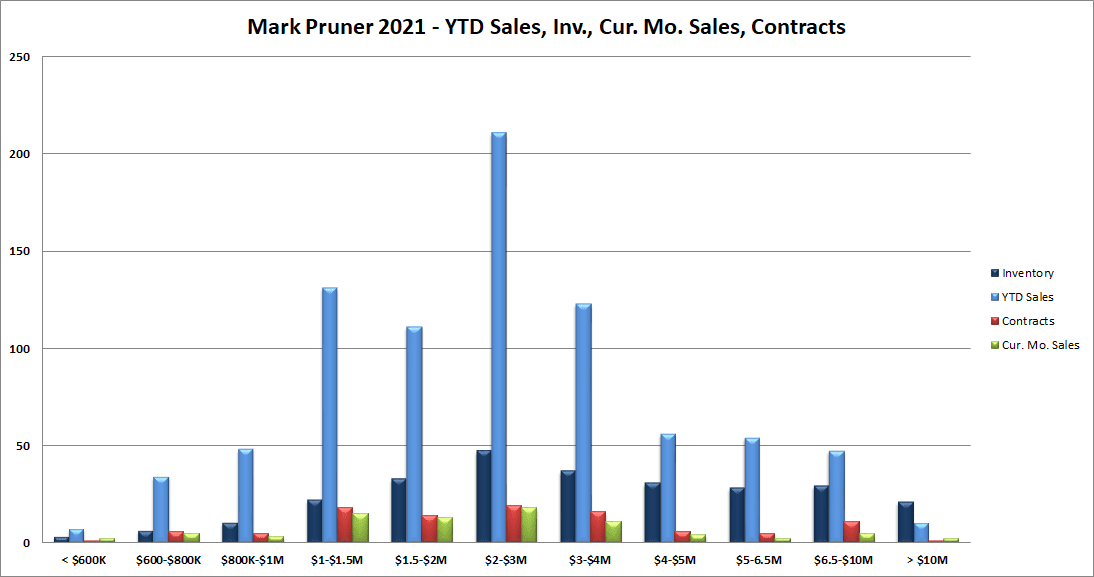
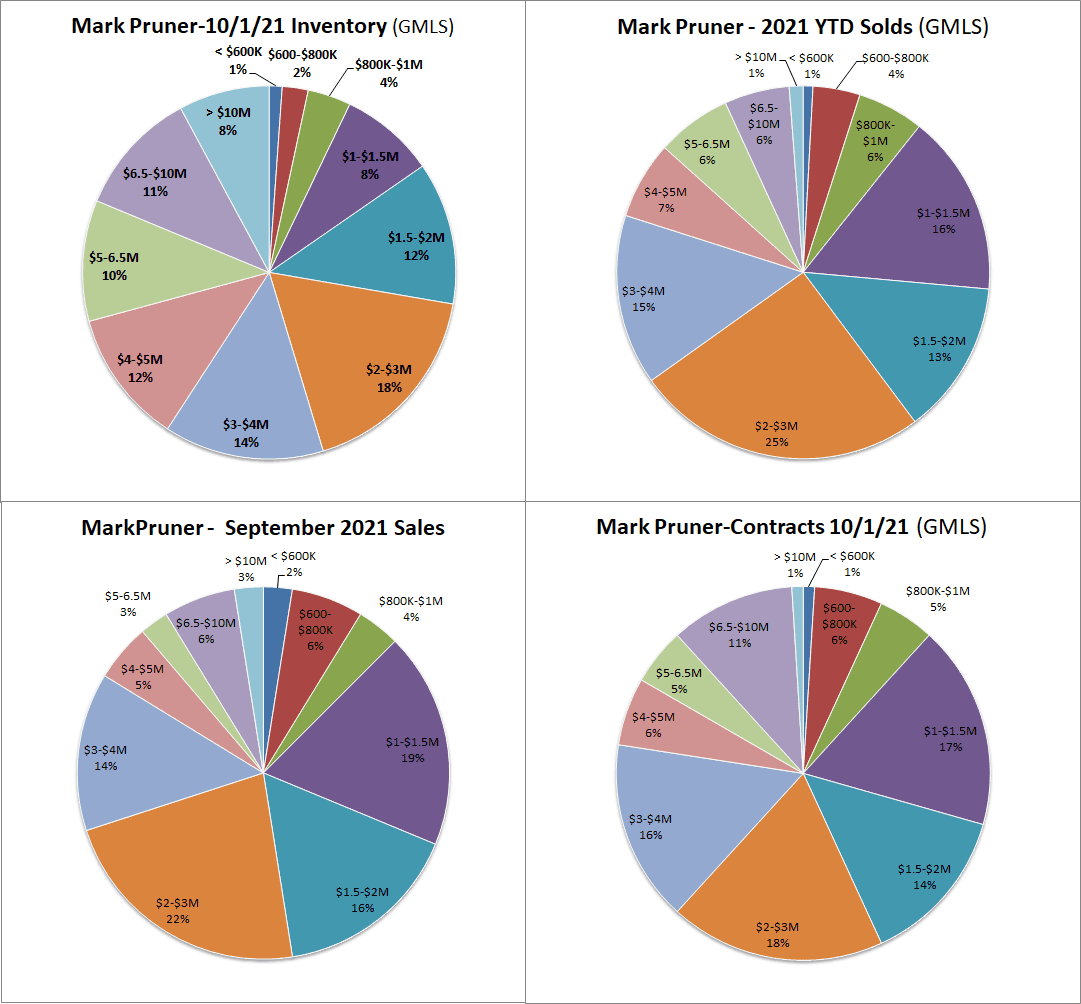
In Greenwich, the heart of the market is from $1 – 4 million and that’s where you see 64% of our sales, 66% of our contracts, but only 52% of our inventory. This market has been strong all year, with the strongest market being from $1 – 1.5 million. I put a house on at $1.3 million in July and we got 6 offers in 3 days, 5 of which were over the list price.
We are also seeing quick sales in all of our price ranges. I had a client that was looking at a house that came on around $2.5 million last Thursday. My clients couldn’t get out to see it until Sunday when an open house was scheduled. Unfortunately, by Sunday it was gone with multiple bids and a canceled open house.
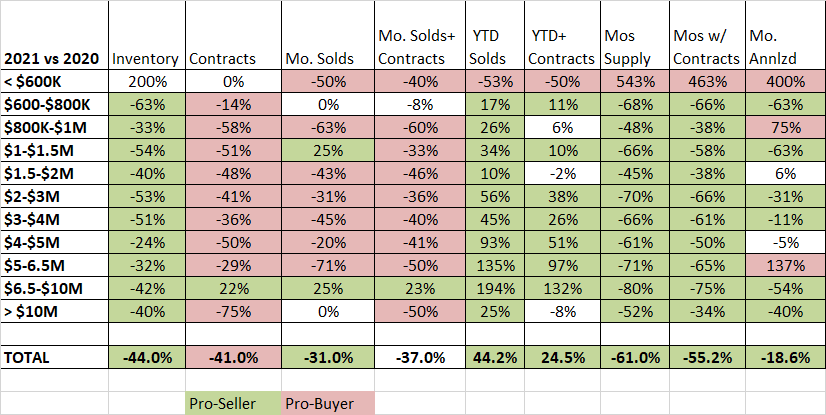
The other price range that has done incredibly well this year, particularly, if you look back several years, is our over $5 million dollar market. We have had 128 sales this year, up from 67 sales last year and way up from only 35 sales over $5 million in the first nine months of 2019. Over $5 million, sales have increased 91% over last year and increased by 265% in 2 years.
Our months of supply for our high-end price ranges have also dropped drastically from 2019 when we had 29 months of supply from $5 – 6.5 million and now have an incredibly low 4.7 months of supply. From $6.5 – 10 million we have gone from 34.1 months of supply in 2019 to 5.6 months of supply in 2021. Greenwich is seen as a good place to invest at the high-end.
The Fourth Quarter and Inventory
The key to sales in the fourth quarter is clearly new inventory. Out of the 267 listings that we have on the market, 61 or 23% have been on for the last 30 days. The median days on market is 106 days. Only 67 listings or 25% have been on for more than 6 months, the old standard for when a listing was considered stale. On the flip side, 167 listings that have been on for more than 6 months have gone to contract or been sold. So being on for a while doesn’t mean the property won’t sell if the buyer and seller are reasonable.
The bottom line is that three-quarters of our inventory is not old, i.e., been on the market for more than 180 days. Of that “old” inventory, more has been sold than is remaining on the market. However, you cut it, our inventory is selling. For the last 6 weeks inventory has stabilized at record low levels of around 265 listings, but it is holding stable, so we are getting listings at the same rate that they are selling.
The question is how long can this keep up? Stay tuned. We may have a fourth quarter as no one has seen before.