How to Lie with Real Estate Statistics
Mark Pruner | March 23, 2024
Real Estate Education & Tips

Mark Pruner | March 23, 2024
Real Estate Education & Tips
Too many years ago when I was taking a statistics class at college we had to read a little book called “How to Lie with Statistics”. It was the most useful book I read at Dartmouth. Its author, Darrell Huff, shows you how numbers can be manipulated to show what the author wants. It also shows how hard it can be to present numbers in a fair way for multiple audiences. So, this week I thought I’d look at some of the most abused numbers.
Greenwich is a very unique town for real estate. only three other towns in Connecticut are comparable; Westport, New Canaan and Darien, all of whom are substantially smaller than Greenwich, which makes our statistics particularly unique. The other towns do have the advantage of being more homogenous than Greenwich whereas in Greenwich Byram, Belle Haven and Banksville attract very different buyers.
While we are larger than the other towns, we still only have 600 – 700 sales per year and sometimes less, (like last year when we only had 527 single family home sales due to lack of inventory). As a result, as soon as you start looking at a particular market in a particular price range for a particular month you will likely have only a handful sales. A few sales up or down for two consecutive months can “change” a rising market into a falling market when the reality is that there is just enough of sales to say either way.
Here’s my five favorite abused numbers:
I. Price Appreciation
I don’t like to talk about price appreciation in Greenwich, because it is the most abused number out there. People calculate price appreciation in a variety of different ways and often arrive at very different numbers for price appreciation. A lot of the national stats that you see in the major media compare the average sales price for this month to the average sales price for the same month last year.
Average Sales Price
In Greenwich that is not a good way to look price appreciation, because our ultra-high end is so high, and our low end doesn’t have a lot of units. The result is that our “average” jumps around from month to month depending on what is selling at the ultra-high-end.
This jumpiness gets extreme when you look at just one area of town. I’ve seen some claims of year over year price appreciation in say Cos Cob of 50% simply because one high end house was sold this month that didn’t sell last year in the same month.
Last February, we had 3 sales in Cos Cob and the average of the sales was $1,193,333. This year we had 5 sales in February and the average was $1,947,500. So mathematically, the number of sales in Cos Cob were up 67% over last year and the average sales price was up 63% over last year. It looks like Cos Cob is doing great, but both numbers are just chatter in the data, the appreciation is nowhere near these numbers.
Median Sales Price
The median, the sales price in the middle, is a better way to calculate appreciation, but it is also affected by changes in marketplace. When the number of sales at the high-end falls the median falls even as the houses in the middle are actually appreciating. This drop in the median price is exactly the opposite result for those houses in the middle price range.
If we look at Cos Cob sales last year, in February, the median sales price was $1,030,000, while the median in February 2024 was $1,772,500 or an increase of 72% which is also not worth mentioning, but I’ve seen reports for Cos Cob that say just that.
Always check if there is enough data to make a statistic significant.
Sales price to Assessment ratio
The indicator of appreciation that I like is the ratio of the sales price to the assessment. If the price is the same as the Greenwich Assessor’s tax assessment then that ratio should 1.42 (the reciprocal of the Assessor’s 70% assessment ratio). However, this indicator also has problems; the major one being that it only works if the Town Assessor got her assessment of the property right.
This ratio also has a built-in bias as each subsequent year from the every 5 year revaluation means that more appeals to the Board of Assessment Appeals result in a lower median assessment. People who have a low appraisal don’t appeal their assessment making the gain look artificial high.
In addition, renovations done after the last appraisal, if a building permit was issued aren’t included, so once again that ratio is biased towards showing greater appreciation. At the same time, new construction and additions that do have building permits are added to the Grand List.
With the rise of Zillow and other housing websites square footage has gotten a lot more important for rankings, price per square foot and listing pricing, but different sites use different sources for their square footage.
Tax Assessor Field Card
You would think that square footage would be an easy number to calculate, but anyone who has ever done a commercial lease can tell you there is no one right answer. In Greenwich, the number that you see on most listings is the square footage from the Tax Assessor’s field card, which is measured from the exterior of the house.
FAR square footage
This number is not calculated the same way that Planning and Zoning calculates square footage for FAR (floor area ratio) purposes. Every day thoughagents use the Tax Assessor’s square footage as being synonymous with Planning and Zoning square footage. In most cases, the FAR square footage will be smaller so a house that is maxed out on FAR based on the Assessor’s number may not be maxed out for P&Z’s FAR, but it’s usually not so much smaller that you canadd on another wing on.
Basements and Attics
The Assessor does not normally count underground basements in square footage just as they are not counted for FAR purposes, but if the basement is a walk out basement then the square footage is included. Attics also usually don’t count, but do count if they are finished and the roof is over 7 feet tall.
New Construction
The other source for square footage is from an architect or builder. Architects generally include the basement and finished attic square footage, especially since builders want to maximize the square footage number that they can put on a property listing.
A. GMLS data issues
I already spoke about averages in calculating appreciation, but the average itself can be manipulated. The statistics from the Greenwich MLS Flex system include houses, condos and co-ops, which I don’t think are very useful, since houses and condos/co-ops are two separate markets.
I’ve also seen GMLS averages that are just houses, but they include all houses listed on the Greenwich MLS. The problem is that the GMLS listings includes out of town listings which obviously skew the average for Greenwich. Right now, 28 of our 150 house listings on the Greenwich MLS are not in Greenwich.
Another GMLS issue is the way the neighborhoods are done. A lot of houses fall into South of the Parkway an area that runs all the way from the Merritt Parkway to the Post Road. Averages for this neighborhood are not that useful since it has several different zones and neighborhoods, each of which has differing supply and demand factors.
Then there are our tiny neighborhoods, like Banksville and North Mianus. These areas are so small as to make anything less than an annual average not very useful. In 2023, we had two reported sales in Banksville, but one was actually in mid-country.
Which is another thing to remember, is that not all of the data is accurate. Every week, I see listings that are listed in the wrong area of town or have some other issue. One year, the highest priced sale in Fairfield County, as reported by what is now the SmartMLS, was a sale for $550 million in the Town of Fairfield. The house was 1,800 square feet and should have been reported as $550,000. If you don’t clean up your data, your averages are going to be wrong.
B. Shift in what’s selling
If there is one thing I hate, it is Zillow’s Zestimate. The Zestimate amount can be close to the sales price, but often it isn’t, and too many people trust the Zestimate. It is often wrong by hundreds of thousands of dollars. It keeps buyer’s from going to see houses they can afford and sellers who need to sell, from talking to an agent, because they think they are underwater.
We one time had a Zillow representative come to our office to try to get agents to advertise on Zillow. He agreed that the Zestimate was horrible, but that it was conversation starter with clients. I want a good estimate, not a conversation starter. I definitely don’t want to spend my first 10 minutes with a client explaining why what Zillow says is wrong.
There are several variations out there and used judiciously they can be helpful, particularly if you know enough about the market and the houses to eliminate the outliers, but if you know that you don’t need Zillow.
The biggest reason is that most numbers you see from local agents are the sales that went through the Greenwich MLS and don’t include many private sales. As I wrote last week, we had 80 private sales, last year that didn’t appear on the Greenwich MLS. What I failed to mention was that we also had 29 private sales that were reported on the Greenwich MLS. These “For Reporting Purposes Only” sales were private sales, but the listing agent was kind enough to report the sale on the GMLS so the rest of us can do comps, averages and other analyses. (Can you have a listing agent, if the property was never listed for sale?)
The best thing to do is to look at a variety of statistics and see which ones are similar. For example, last year the sale of Copper Beech Farm skewed all of our averages, but not our median numbers.
If you are really confused, you can always give me a call. :)
Mark Pruner is a sales executive with Compass Connecticut and a member of the Greenwich Streets Team of agents. He can be reached at 203-817-2871 or [email protected].
Stay up to date on the latest real estate trends.

Blog

Blog
Blog
What the Numbers Actually Mean for You

Blog
What Every Greenwich and Stamford Pet Owner Should Know

Blog
What Actually Matters (And What Doesn't)
Market Report
Stamford, CT
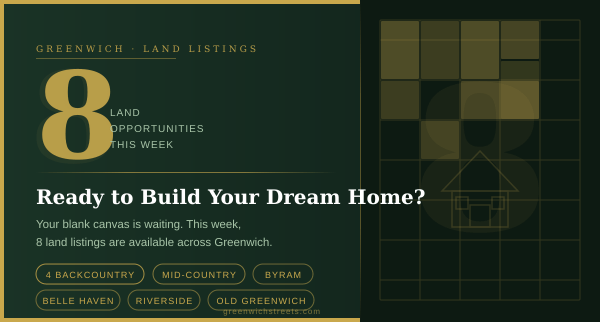
We have 8 options for you
Blog

Blog
Discover the best places to live across Greenwich
We are a dedicated group of Greenwich natives. We have a deep passion for our hometown and enjoy everything the town offers its residents from the beach front to the backcountry. That is why we don’t find you just any home, we find you the right home.
MARK PRUNER
DENA ZARRA
RUSSELL PRUNER
COMPASS
200 Greenwich Ave
3rd Fl Greenwich, CT 06830