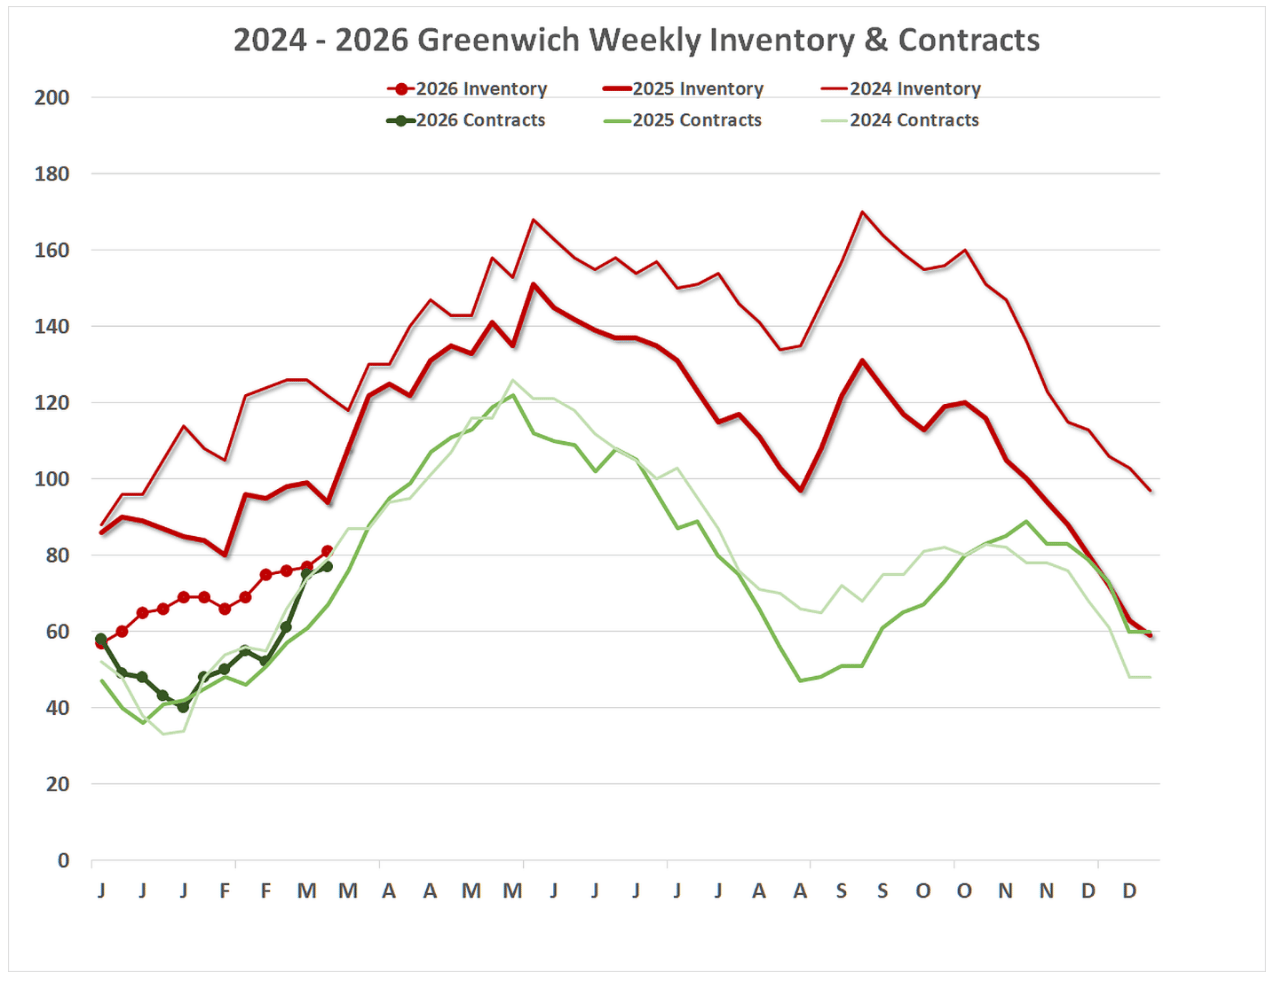
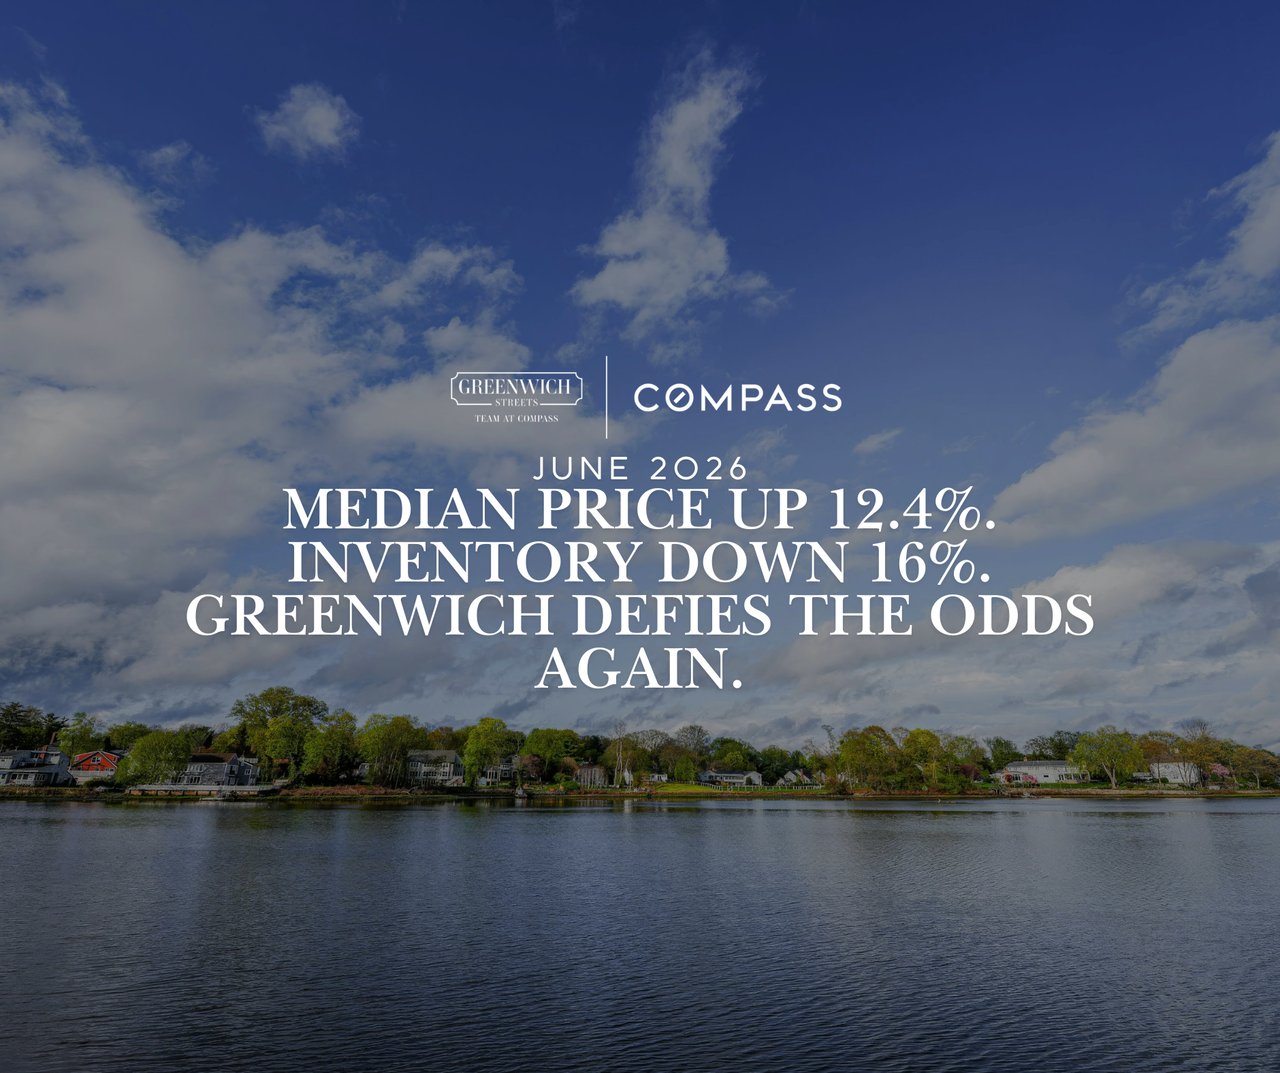
Our inventory should be going up at this time of year, and it is just a smidgen. We are up from 75 listings at the beginning of March to 81 listings at the end of March. Only last year though, we had 110 listings at the end of March. Go back to the pre-Covid times and we had 581 listings at the end of March 2019. Our inventory is down 27% from last year and down 86% from 2019. It’s hard to sell houses you don’t have.
Having said that, something remarkable, and counter-intuitive, is happening. Our first quarter sales are up from last year’s 74 sales to 87 sales this year or an 18% increase. So how can inventory be down a lot and sales still be up? Blue moons, what I call a listing that comes on and goes to contract in the same month. We had 29 sales last month and 13 of those sales, or 45%, came on in March and were sold by the end of the month. Also, as of the end of March we had 78 contracts outstanding. Of those 78 contracts, 45 of them got to contract in less than 30 days from their list date.
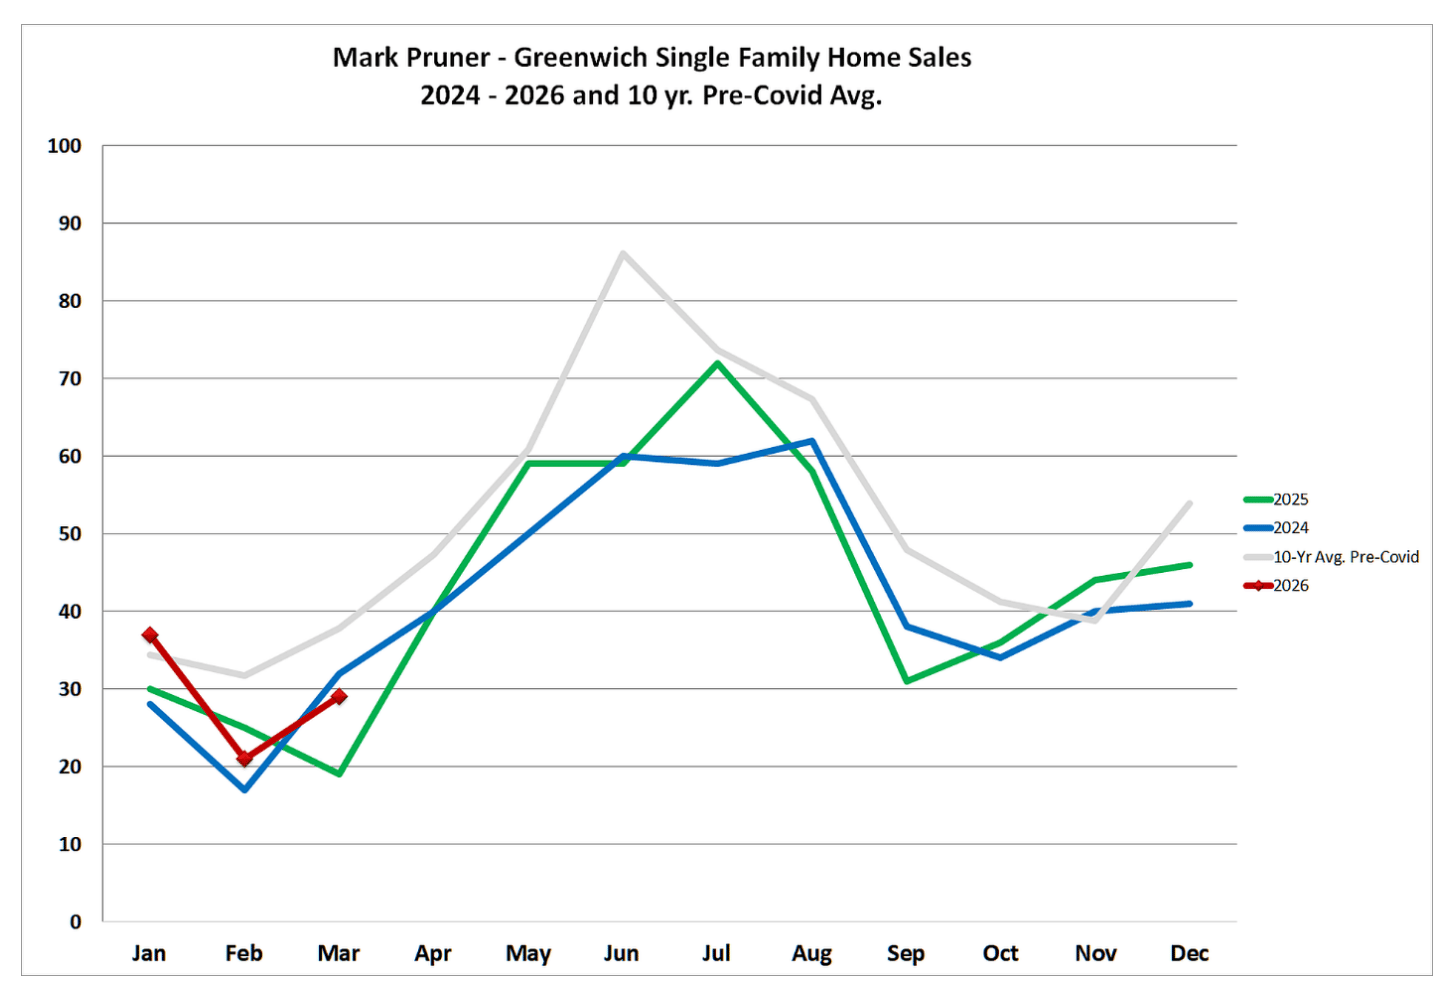
Our 87 sales this year were also the highest we’ve had in the 4-year post-Covid inventory drought that started in 2023. We are, however, still well below our 10-year average of 110 sales in the first quarter. If we had more inventory, we would have even more sales.
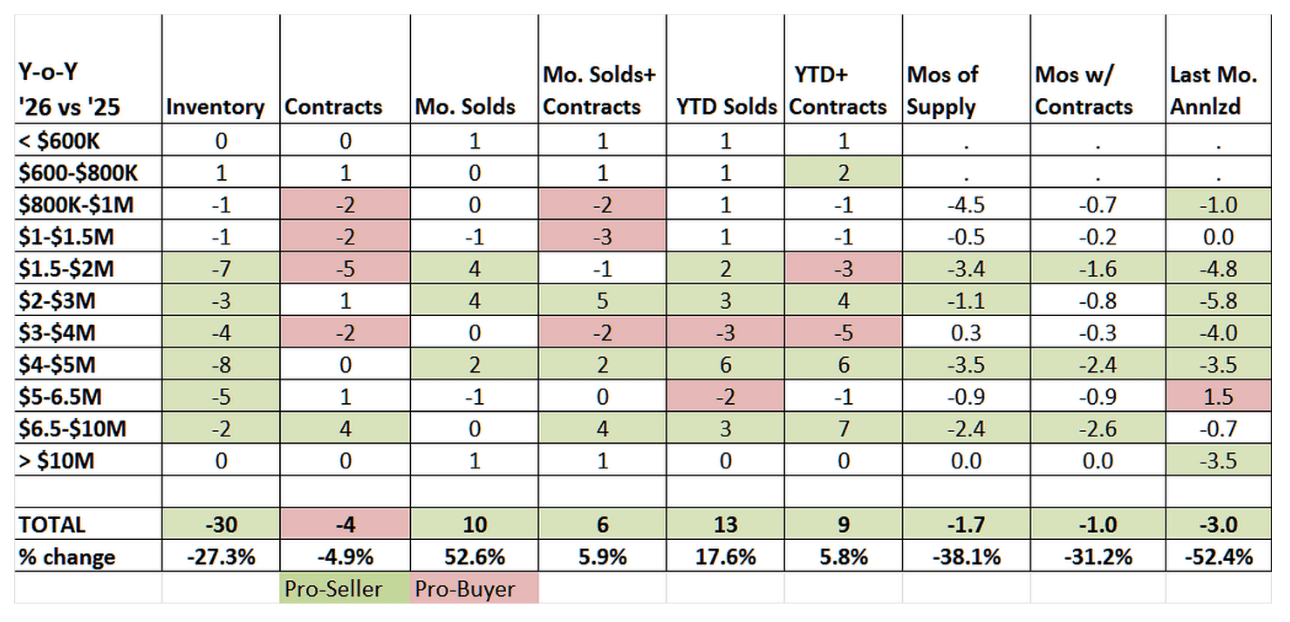
Our sales, however, may not continue to beat 2025 sales as our contracts are down in most price categories under $4 million. April and May are our big months for adding inventory, so keep your fingers crossed that we will see an inventory surge in those two upcoming months.
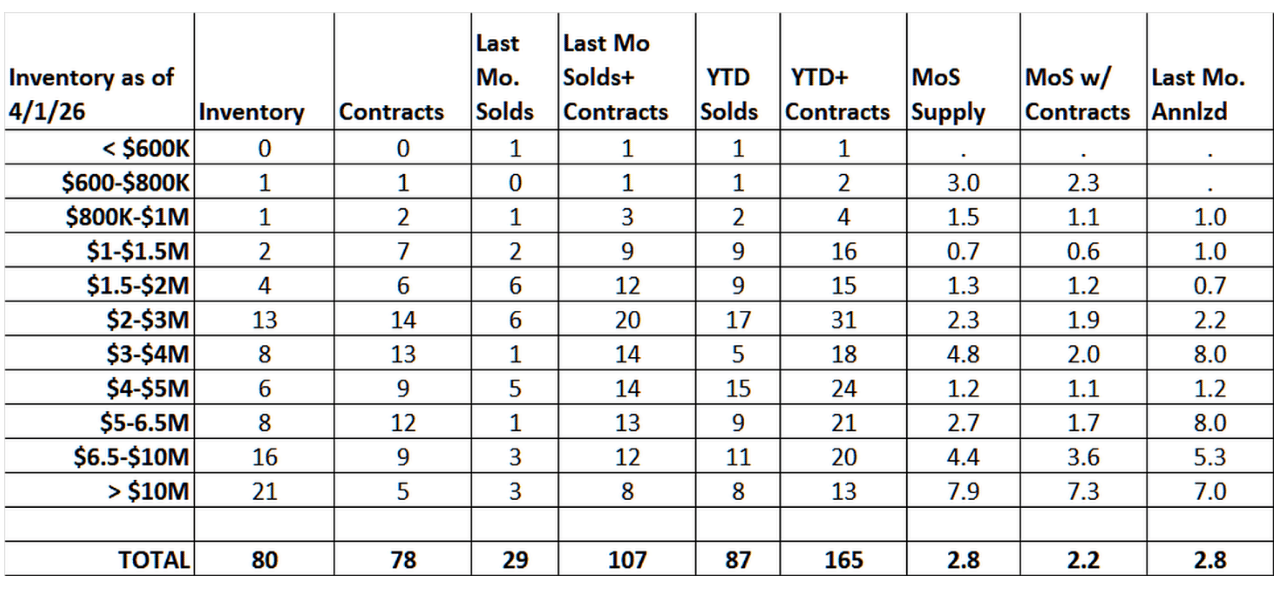
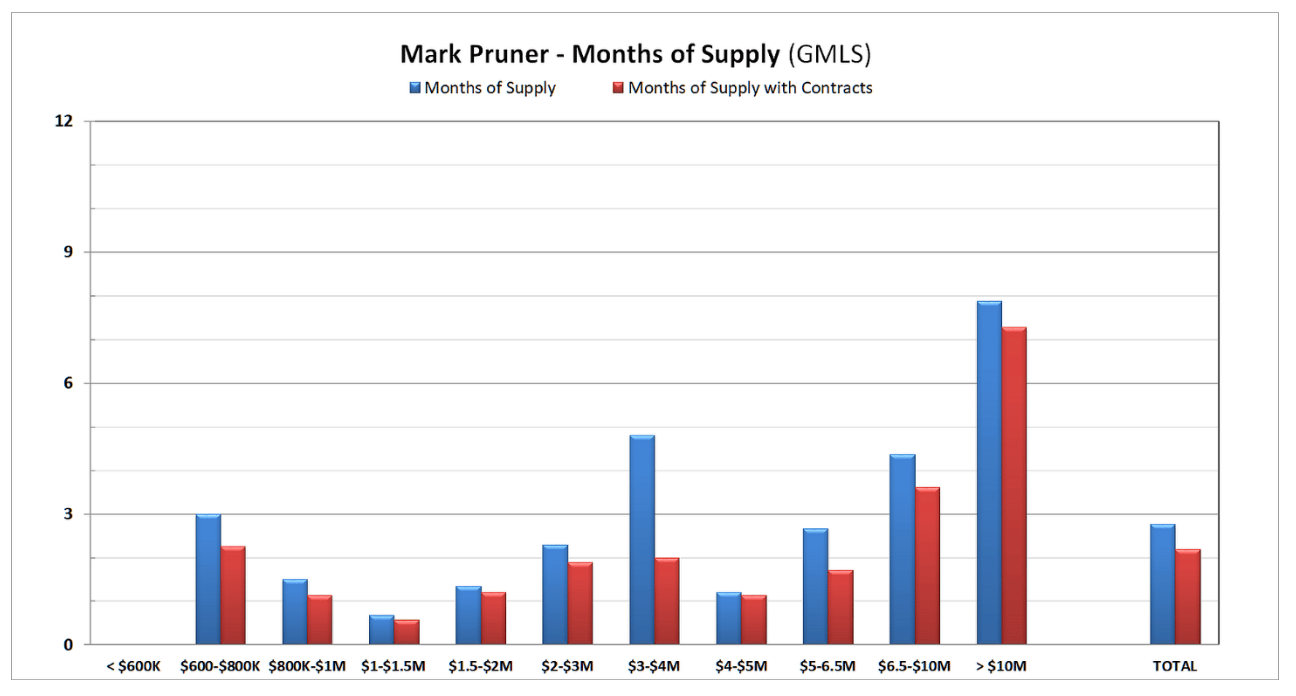
With lower inventory and faster sales our months of supply are also down. Overall, we are at a remarkably low 2.8 months of supply, down almost 1.7 months from last year. Add in our contracts and assume they will close in an average of 45 days, and we are down to only 2.2 months of supply with contracts.
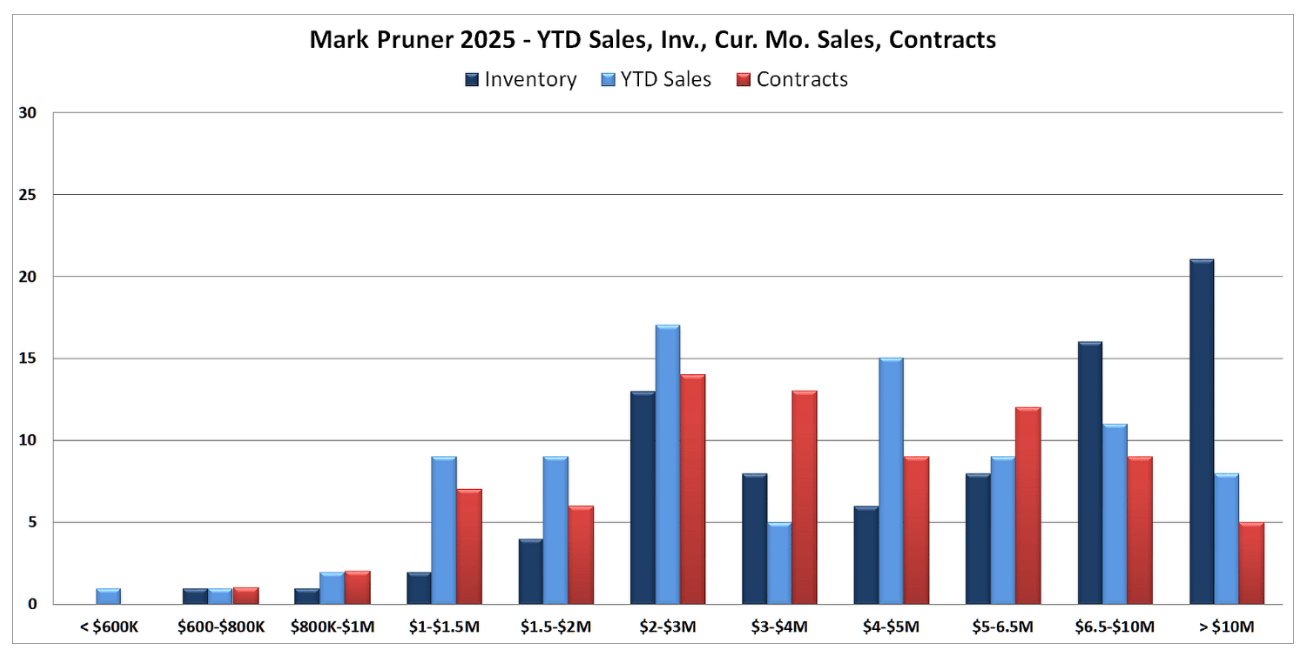
The only price ranges that have arguably gotten a little more pro-buyer are those from $800K to $4 million, but there is little to sell also in those price ranges. We only have 28 listings in what is traditionally the heart of our market.
Above $5 million, inventory is down and sales are about the same, up 1 sale from 27 sales last year to 28 sales this year. Our highest sale so far this year is for $27,800,000 at 45 Binney Lane, closely followed by 555 Lake Avenue at $27,500,000.
Greenwich is a super-sellers’ market with less than 3 months of supply in every price range under $6.5 million. Under $1.5 million, we only have 4 listings. Over $5 million we do have 45 listings, but that is down from 52 listings last year. Our sales and contracts over $5 million are also up this year. Where we have inventory, we have sales.
In just about every price category, the number of contracts exceeds the amount of inventory that we have. Only above $6.5 million do we have more inventory than we have contracts.
Prices
When you look at the change in prices from last March, you’ll find a mixed bag. The average sales price is down 6.8% from last March dropping from $5.18 million last year to $4.83 million this year. If you remember, last year was an all-time high for sales over $10 million, much of this happened in the 3rd quarter. Our average sales price is down because the mix of what is selling has changed. When we get a lot more sales at either end, the average moves.
A better measure in a changing market is the median price, but still not the best statistic. Unlike the average price, which was down 6.8%, our median price was barely lower, dropping only 0.6% from $3.85 million to $3.83 million.
This is not the case with the price/sf, a better statistic. There we see an increase in median from $802/sf last year to $896/sf this year or an increase of 11.7%. If you look at the sales price to assessment ratio, (my favorite for most revealing price stat), there you see an increase of 12.3% in prices. Based on these two numbers prices are up double digital percentages from last year. Prices are still going up, it’s just that if you just look at the average sales price, that is down due to slightly slower very high-end prices.
Supply and demand
As noted above, supply is down and demand is up. Our inventory is lower, but sales are higher. These are not the only indicators of a more pro-seller market. Our median sales price to original list price for the first quarter of 2026 is right at 100.0% up from 97.5% in the first quarter of 2025. Our days on market has also dropped drastically. The median DOM this year is only 32 days compared to 54 days in the first quarter of 2025.
All in all, a very competitive market.
Mark Pruner is a founder of the Greenwich Streets team at Compass Connecticut, along with Russ Pruner and Dena Zarra. Mark can be reached at 203-817-2871 or [email protected].