I don't like to talk about average house prices in Greenwich and particularly don't like to talk about changes in the average house price from year to year. Too often, homeowners look at the percent increase and apply that to what they thought was worth last, and come up with a new number. In most cases, that number is wrong, sometimes low, often too high.
The problem is that much of the changes in the average house price in Greenwich are strongly affected by the mix of what is selling from year to year. Last year, our over $10 million market set a record number of houses sold with 38 sales. This was exactly double our previous record of 19 sales over $10 million that happened in 2007 at the height of the go-go digits decade.
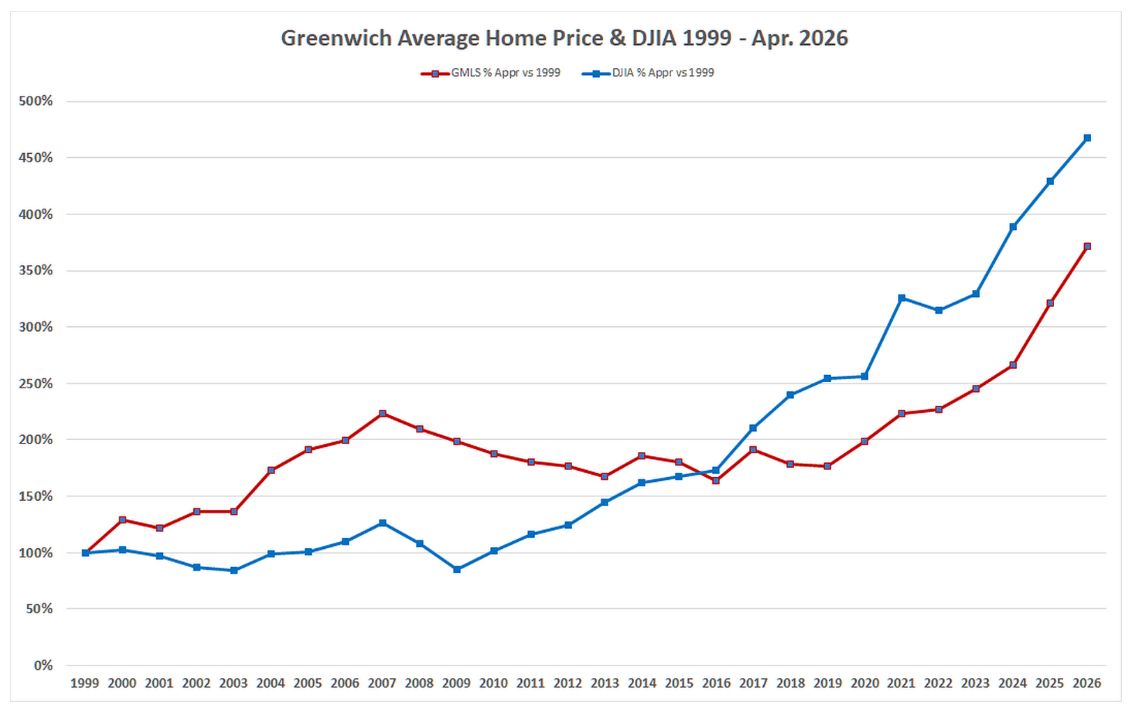
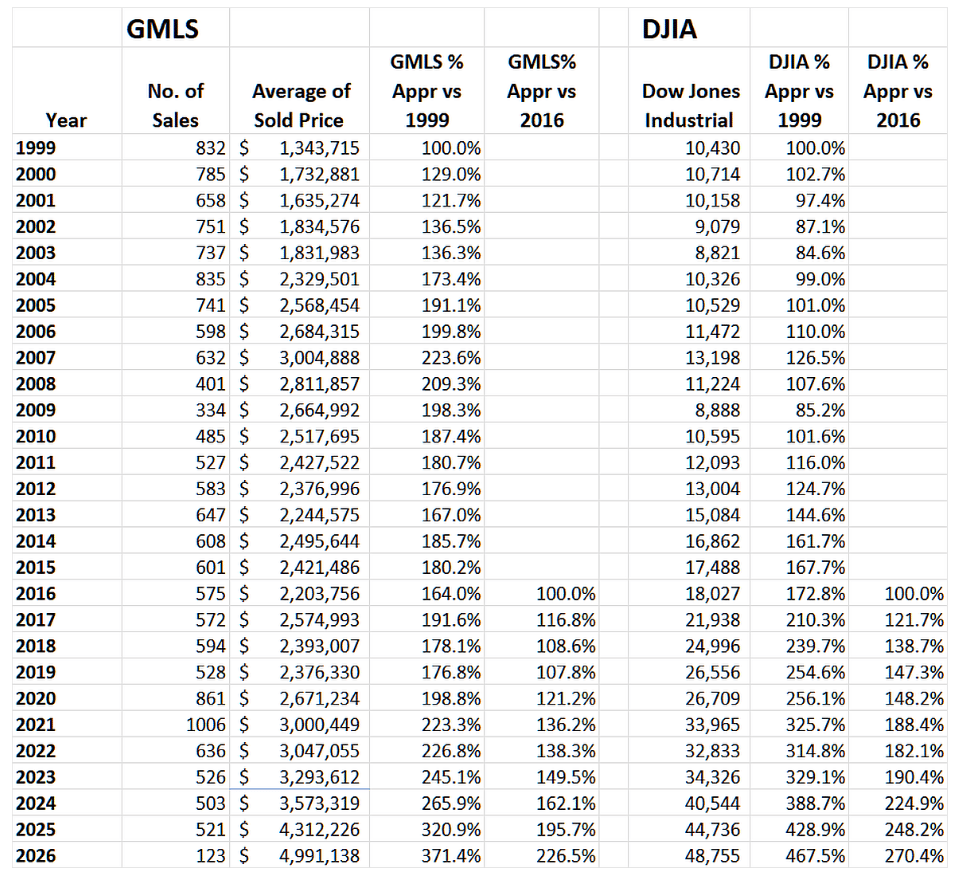
As you might expect, with all those ultra-high-end sales pulling up prices, 2025 was a good year for appreciation, with the average sales prices up 20.7%, while the median price was up only half of that. Having said that, the average price combines both the number of sales and the sales prices. So, let's do what a bunch of people have asked me to do: compare stocks to Greenwich real estate. (See even more caveats at the end of this article.)
Greenwich house prices generally go up. My brother, Russ, has data going back to 1976. (He's been doing this for a while.) Prior to 1999, which is as far back as the GMLS data goes, the average Greenwich house only fell in three years, 1990, 1991, and 1995. Two times the price went down by 2%, and once by 3%. The other 20 years from 1976 to 1998, the average price went up, and sometimes the appreciation was spectacular. In 1984, the average price went up 14%, followed by 18% in 1985, and our biggest annual appreciation ever in 1986, when prices went up 43% in one year. In 1984, the average house price in Greenwich was $389,000; by 1986, it was up $656,000 or an increase of 69% in three years.
We have had a spectacular increase in prices since 2023, but it's up only 40%. What is not shown in these numbers is just how much of that appreciation was due to inflation. Russ and I bought our bachelor pad in the early 80's (1,428 s.f. on 0.09 acres), and our initial interest rate was 14.7%. Fortunately, hard assets, including personal residences, have traditionally been a good inflation hedge, and they were for us.
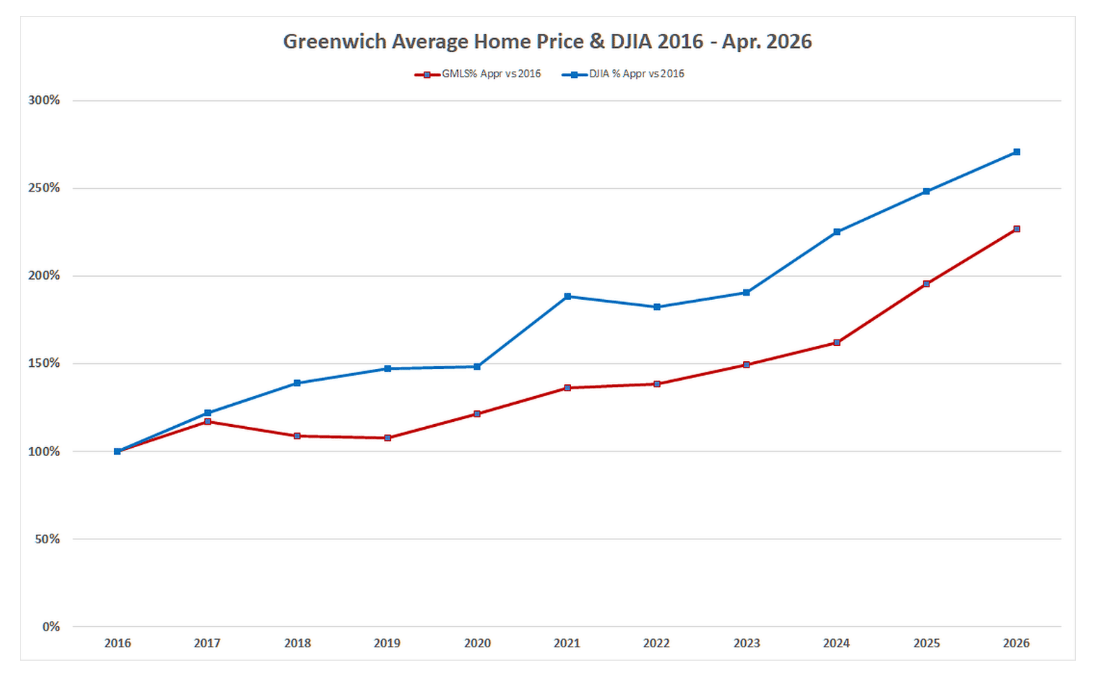
In the last ten years, single-family home appreciation has been well above inflation. The average price in 2016 was $2.203 million, and so far this year it has been $4.991 million. Some of this was general inflation, and for the last two years a significant part of the appreciation was a an incease sales in higher-end houses. In 2024, we sold 50 houses over $4 million, and in 2025, this number had increased by 20% to 60 sales. Even more so, the high-end became very high. We sold 16 houses over $15 million in 2025 compared to only 3 houses over that price in 2024.
Two sales distorted the number so much that I excluded them, and it was the same property. In 2014, Copper Beach Farm sold for $120 million. Nine years later, it sold for $138.8 million. These two sales pulled the average house sales price in Greenwich up by more than $200,000 in each of those years.
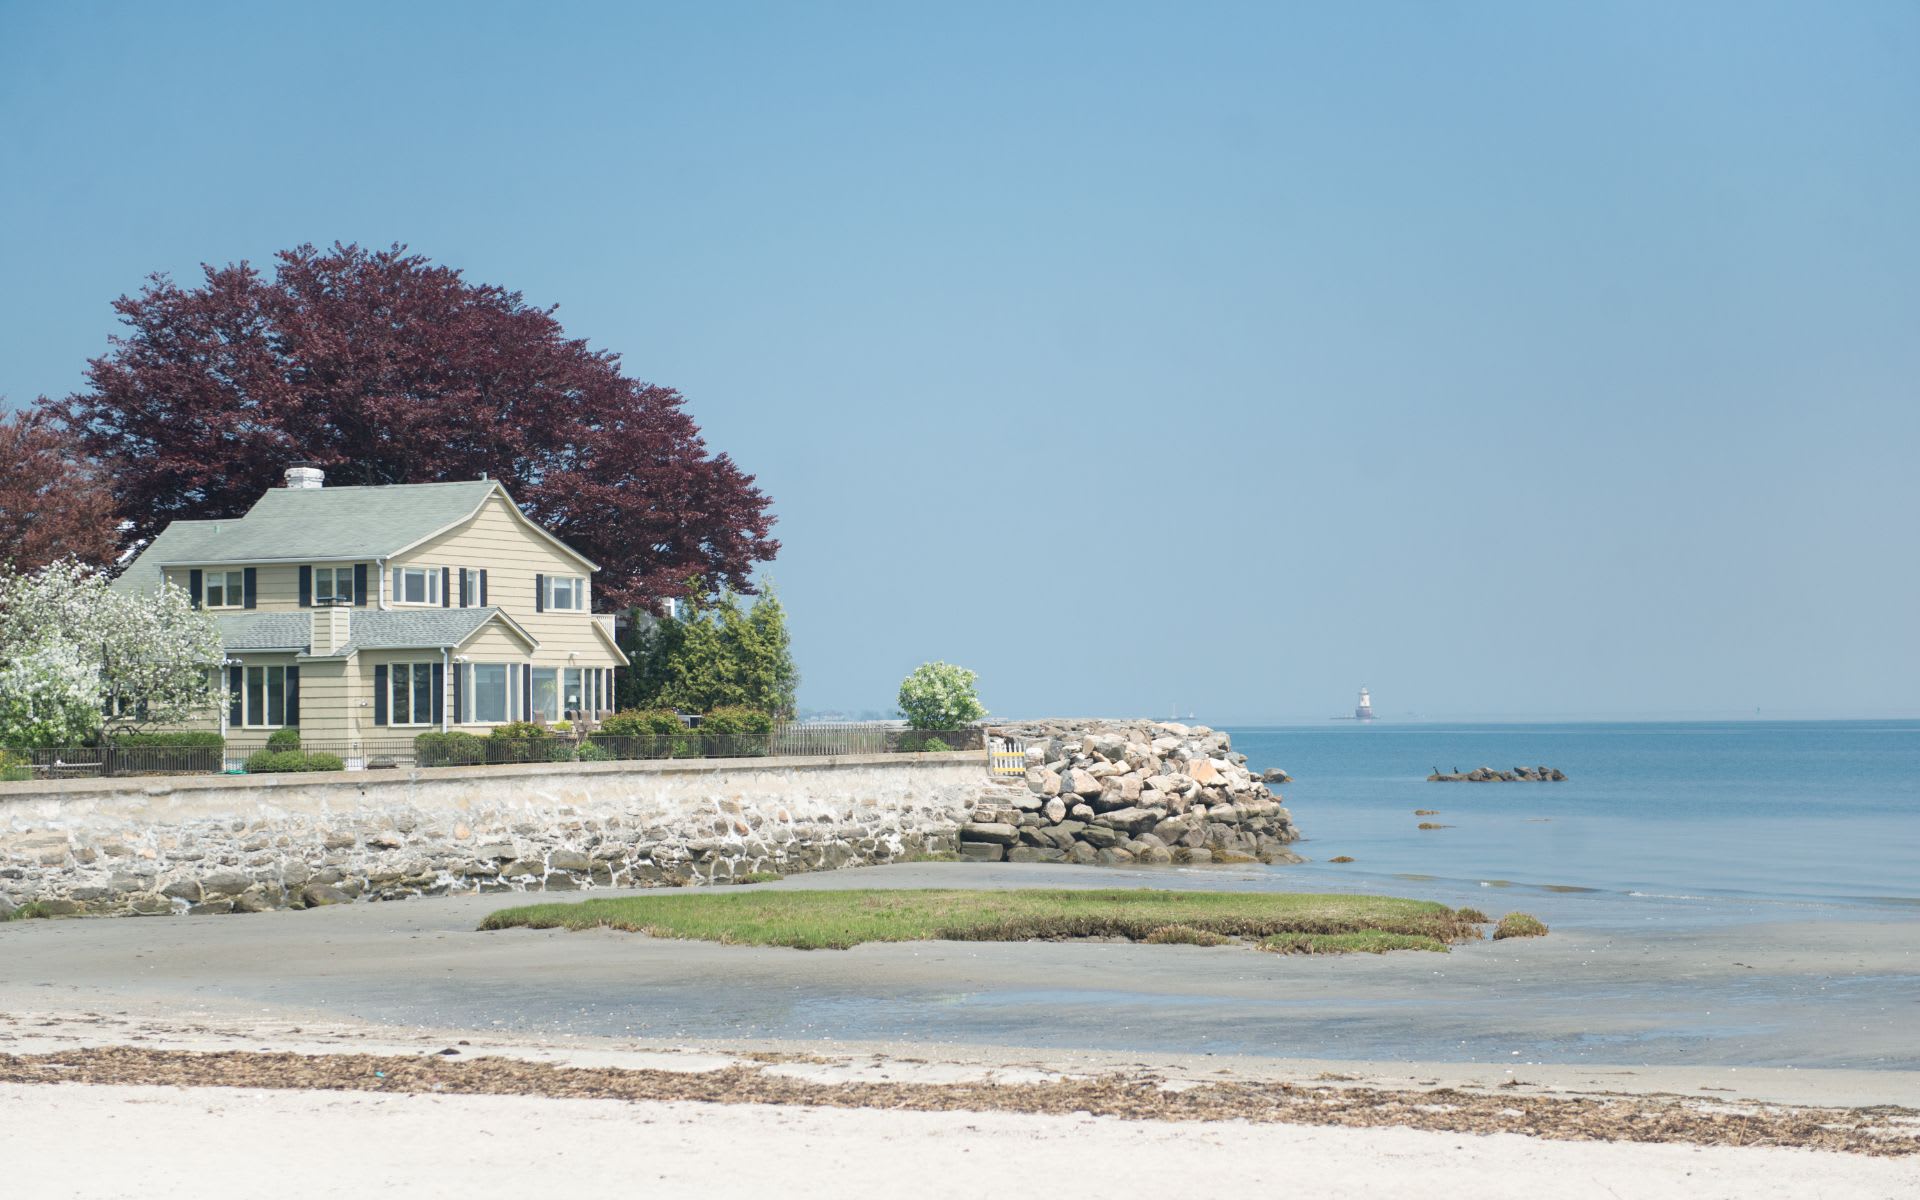
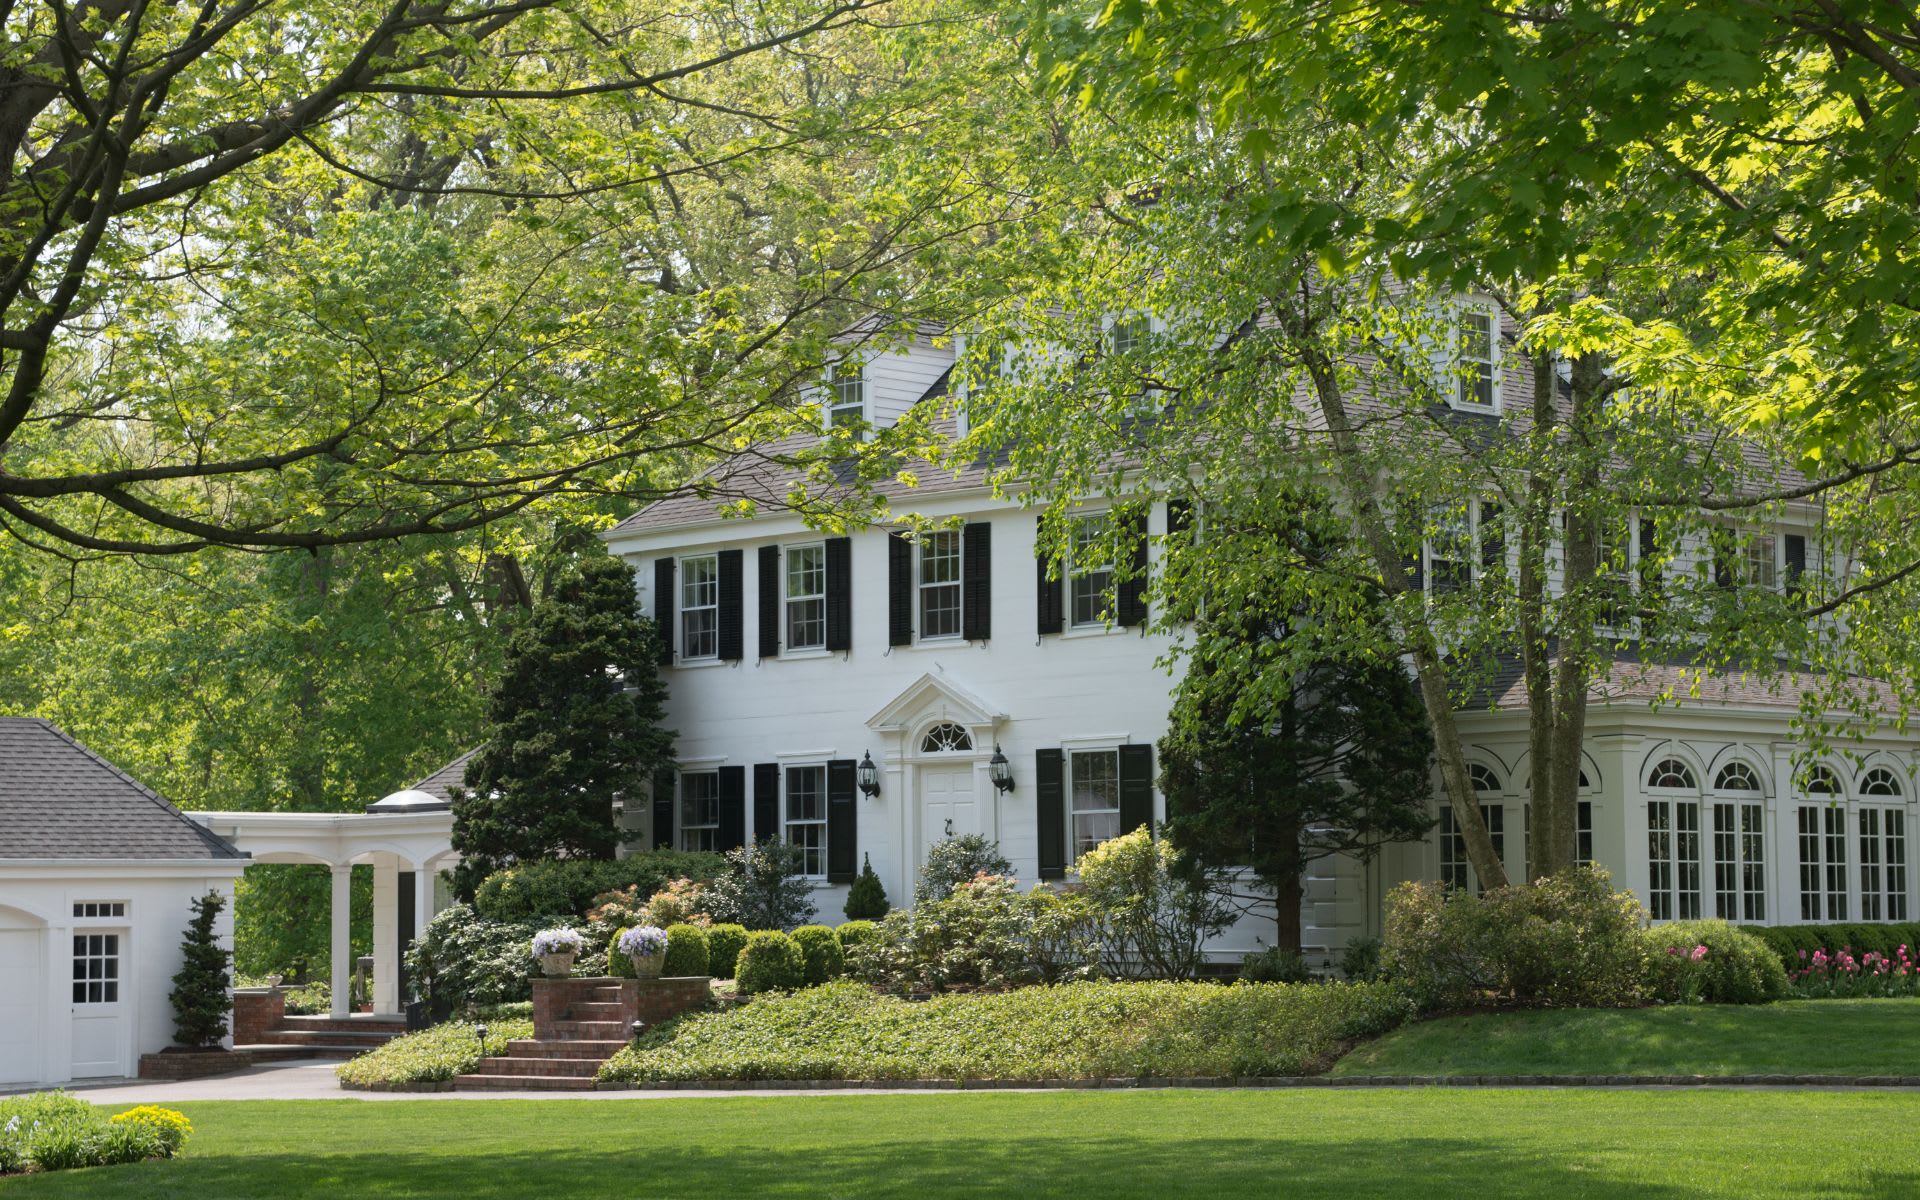
Having said all that, the Great Recession hit Greenwich especially hard. Our average price dropped from $3.0 million in 2007 to $2.2 million in 2016. Once again, much of this was the mix of what was selling. Big houses on lots of land fell out of favor. Greenwich also lost some of its panache as we saw Manhattan, Brooklyn, and the Hamptons become the in places to live. Even during this 10-year period, front country, Old Greenwich, Riverside, downtown Greenwich, and the waterfront recovered much quicker and saw many years of appreciation even as the average price continued to fall.
Then came Covid, all of those big, lonely houses now seemed to provide lots of spaces for people who were in their houses for months at a time. All of those big acreage lots that were paying higher taxes and had to be landscaped a lot turned out to be great for outdoor recreation.
Our average price has climbed steadily since 2019. Demand was so high that we sold all of our shadow inventory. Luckily, we had a good number of sellers who were waiting for the right year to sell, and that was 2020 with 861 sales, only to have that record broken the next year with 1006 sales, our first and likely last year with 4-digit sales.
With the shadow inventory gone, we saw inventory drop even as demand stayed high. We are seeing a 4-year trend of lower and lower inventory as the Dow reaches new highs. This is the recipe for higher prices.
As for the aforementioned caveats, houses are not stock certificates. While you can't live in a stock certificate, you can sell it quickly. Houses also have annual operating expenses that are higher than holding stocks. (Then again, have you seen what some of those investment funds charge?) Houses also don't pay dividends, nor do they have stock splits. They do create pregnancies and the occasional divorce.
The trends over the last few years are clear, but how long will they continue?
Stay tuned …
Mark Pruner is a founder of the Greenwich Streets Team at Compass. He can be reached at 203-817-2871 or [email protected].