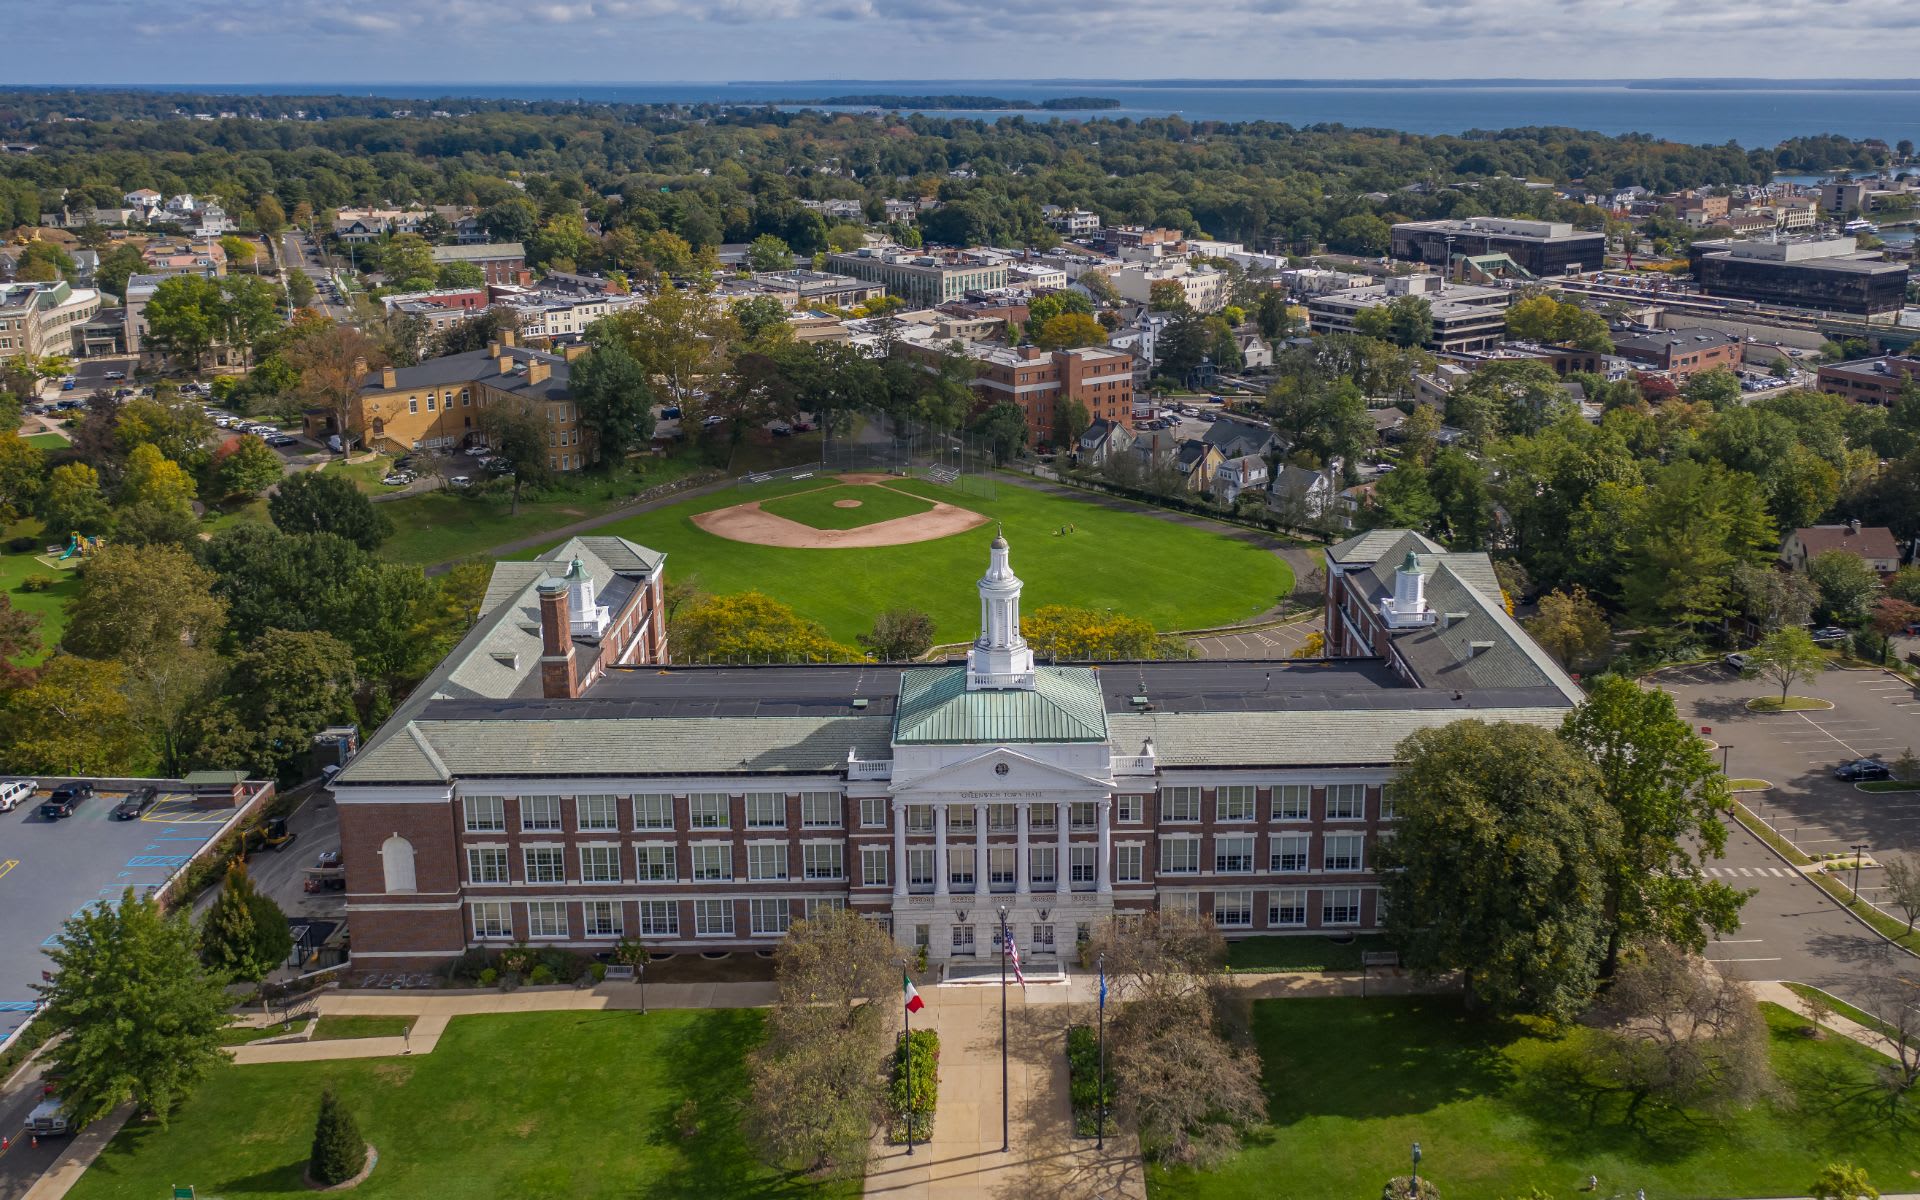
Townwide Overview
| |
Grand Total |
| # Sold |
593 |
| Avg SP |
$ 2,396,448 |
| Avg DOM |
202 |
| Avg. SP/SF |
$ 564 |
| Avg of SP/OLP |
90.7% |
| Avg. SP/ASMT |
1.611 |
| Post 2015 Appr |
13.4% |
| Post 2015 Construction |
48 |
Last year we had 593 home sales in Greenwich, up 26 sales or 4.4% over 2017. Our average sales price was just under $2.4 million which was a drop of about $188,000 or 7%. Most of this drop in the average sales price is due not to a drop in home values in Greenwich, but to an nearly 60% jump in sales from $800,000 – $1 million and 25% drop in sales from $5 – 10 million. When the sales below the average price increase and sales above the average price decrease, the average price will drop.
Still, what most people want to know is whether the value of their house went up or down last year. The answer is it depends, particularly, on what neighborhood your house is in and what price bracket it is in. In a prior article this month, I looked at how houses in various price ranges in Greenwich did. Let’s look at how the neighborhoods are doing from north to south and then from west to east.
Backcountry
| Section |
North Parkway |
| # Sold |
45 |
| Avg SP |
$ 3,441,086 |
| Avg DOM |
300 |
| Avg. SP/SF |
$ 509 |
| Avg of SP/OLP |
87.7% |
| Avg. SP/ASMT |
1.552 |
| Post 2015 Appr |
9.3% |
| Post 2015 Construction |
4 |
In backcountry Greenwich we had 45 sales in 2018 up 1 sale from 2017. Backcountry also has the highest average sales price at $3.44 million. This unfortunately is down from a $3.77 million price last year, thought once again, much of the change in the average sales price is due to the weak sales from $5 – 10 million, where backcountry has half of all the listings in Greenwich.
As to prices, we have three indicators; sale price per s.f., the percentage of sales price to original list price and the sales price to assessment ratio. All three of these indicators were up from 2017, but they are not what you would call robust. The average sales price to original list price percentage in backcountry was up 8.2% from 79.2% to 87.7%, but this unfortunately is still the lowest SP/OLP of any neighborhood. It still however is very good news as demand is better and original pricing is more realistic.
The sales price to assessment ratio also went up substantially from 1.30 in 2017 to 1.55 in 2018. Part of this is the fact that we had 4 spec homes built after the 2015 that were sold in 2018. Here the 2015 assessment is of the vacant land or teardown that was there before. A 1.42 ratio is no change from the assessment (it’s the reciprocal of the 70% assessment ratio). With new construction in backcountry you get assessment ratios of 8.54 and 5.65 for the 2 of the 4 new houses sold last year. This really throws the average off when there are only 45 sales. Overall though 2018 was a better year for sales in the backcountry than 2017.
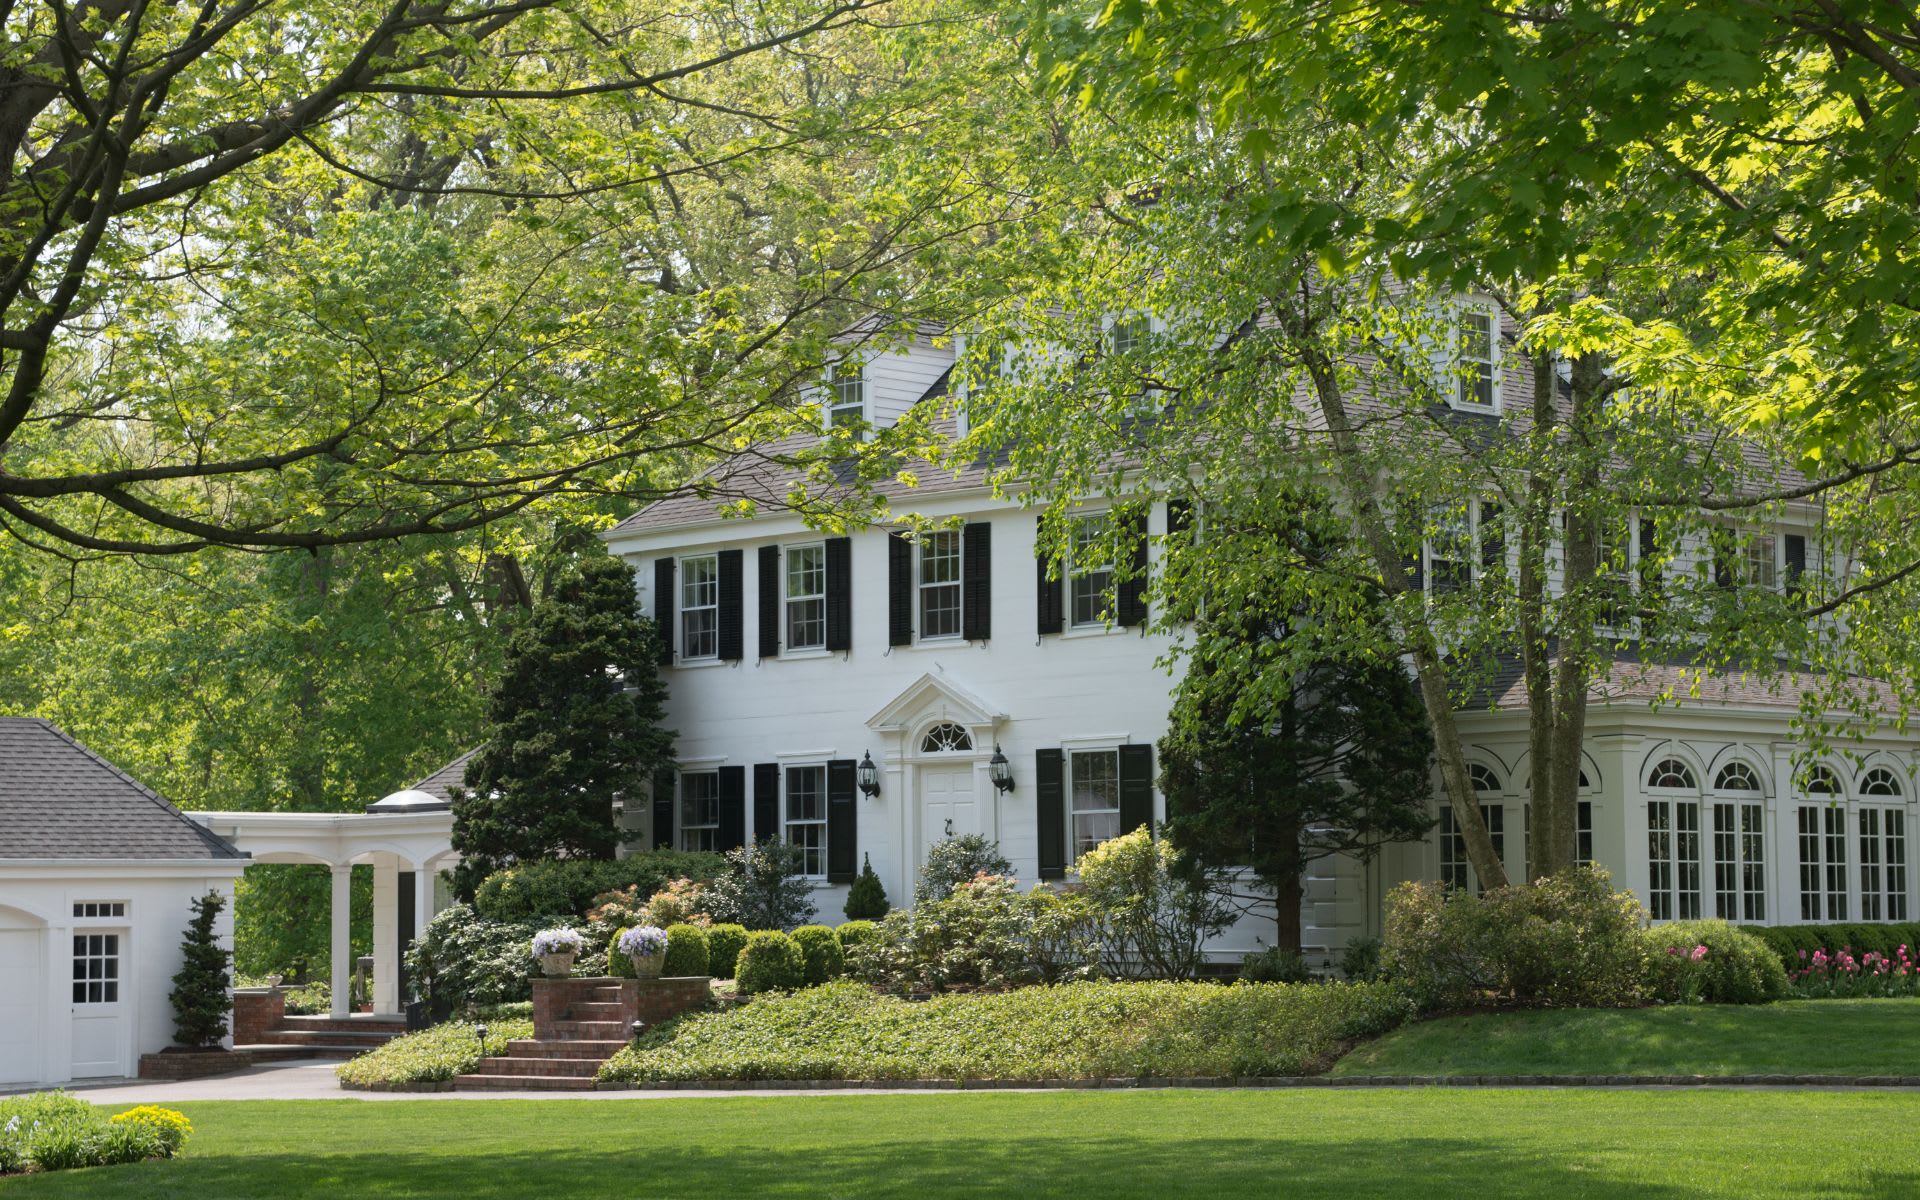
Mid-Country
| Section |
South Parkway |
| # Sold |
161 |
| Avg SP |
$ 3,083,963 |
| Avg DOM |
223 |
| Avg. SP/SF |
$ 570 |
| Avg of SP/OLP |
89.1% |
| Avg. SP/ASMT |
1.478 |
| Post 2015 Appr |
4.1% |
| Post 2015 Construction |
7 |
If backcountry is on its way to recovering from a cold, mid-country is thinking about going back to work. Average days on market at 223 days is only a little higher than the townwide average of 202 days on market; and both are down from 2017. The average sales price to original list price is up a smidge to 89.1% from 88.5%. Unfortunately, this is 89.1% is still the second worst of any neighborhood after backcountry.
We have 161 sales in this area which runs all the way from the Post Road to the Merritt Parkway which ties Glenville for the biggest drop in sales Y-o-Y at 10 fewer sales. We do have 7 post-2015 houses that were sold in mid-country and a whole bunch more custom houses being built for people who bought the land. A client of mine is building 3 high-end houses in this area and the cool CGI pics can be seen if you Google 598 North St.
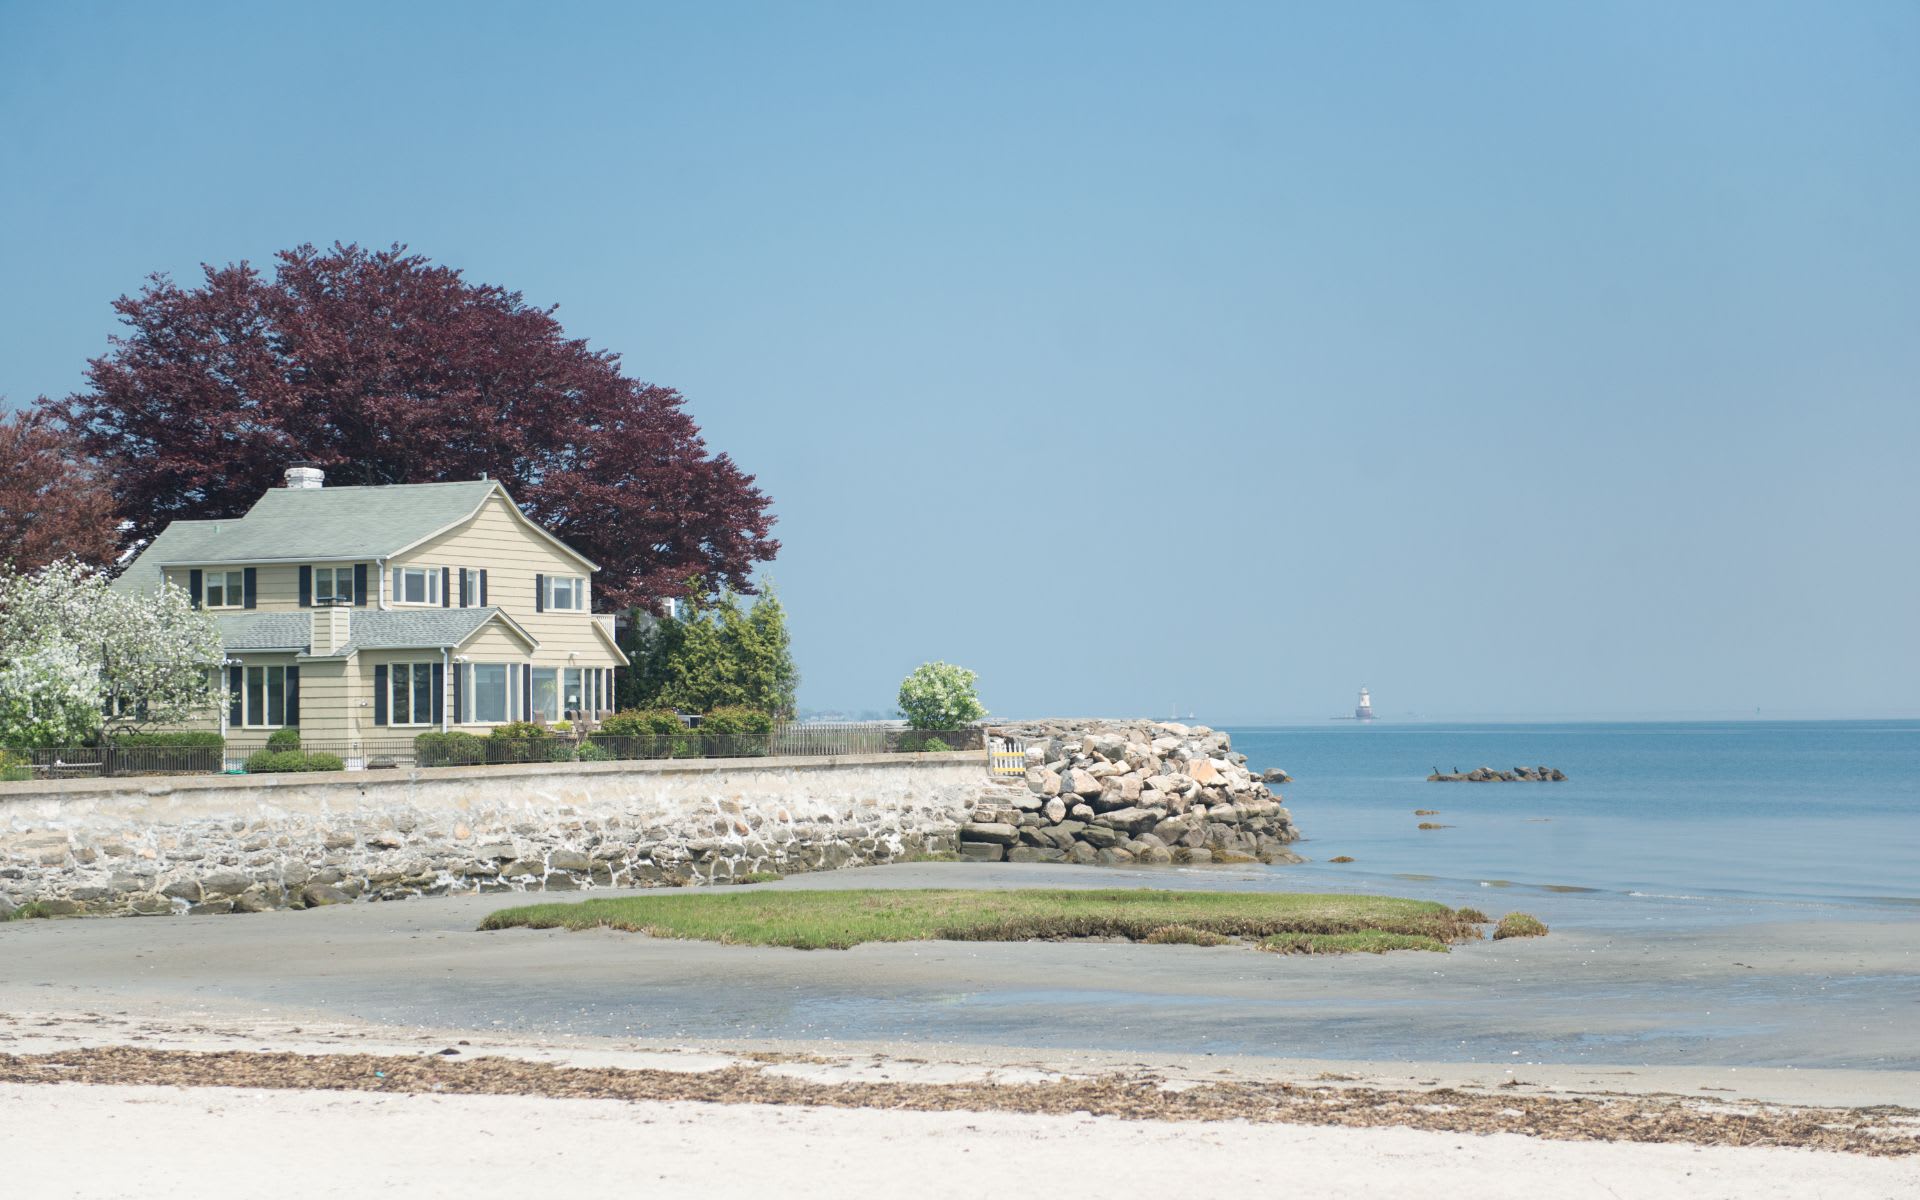
South of the Post Road
| Section |
South of Post Road |
| # Sold |
58 |
| Avg SP |
$ 2,322,000 |
| Avg DOM |
218 |
| Avg. SP/SF |
$ 684 |
| Avg of SP/OLP |
91.8% |
| Avg. SP/ASMT |
1.755 |
| Post 2015 Appr |
23.6% |
| Post 2015 Construction |
4 |
Like South of the Parkway, South of the Post Road is another eclectic, catchall, MLS defined area. It includes downtown Greenwich, Chickahominy, Bruce Park, Belle Haven and Mead Point. The high-end waterfront and gated community properties give this area the highest price per s.f. at $684 though this is slightly down from last year’s $724 per square. The area also has the second highest sales price to assessment ratio at 1.755 which equates to a 23.6% increase over the last 3.3 years since the Oct. 1, 2015 revaluation date.
Glenville
| Section |
Glenville |
| # Sold |
34 |
| Avg SP |
$1,104,860 |
| Avg DOM |
192 |
| Avg. SP/SF |
$407 |
| Avg of SP/OLP |
90.0% |
| Avg. SP/ASMT |
1.742 |
| Post 10/1/15 Appr |
22.7% |
| Post 2015 Construction |
2 |
Glenville continues to be a tighter market than most in town. It has the second lowest average sales price at $1.1 million. The average house in Glenville is 2,732 s.f. and sells for $407/s.f. which also the second lowest after Pemberwick. The sales price to assessment ratio is 1.742 which equates to 22.7% appreciation (1.742/1.42) since 2015. This puts Glenville in the same group with Byram (23.0% appreciation), Cos Cob (23.2% appreciation), and South of the Post Road (23.6 appreciation). Now this appreciation is over more than three years, but it is in the right direction.
You would think that houses would be flying off the shelf in Glenville and days on market at 192 DOM is 10 days better than average for the town, but there was some tough bargaining with the average sales price to original list price ratio being 90.0% only a little better than mid-country. Still it’s doing well, you just have to price it right.
Pemberwick
| Section |
Pemberwick |
| # Sold |
11 |
| Avg SP |
$700,909 |
| Avg DOM |
130 |
| Avg. SP/SF |
$394 |
| Avg of SP/OLP |
94.3% |
| Avg. SP/ASMT |
1.636 |
| Post 2015 Appr |
15.2% |
| Post 2015 Construction |
0 |
If you want a good deal and a nice neighborhood in Greenwich, check out Pemberwick. We only had 11 sales last year due to tight inventory so our DOM was an impressive 130 days, the second lowest in town. You also had a sales price to list price percentage at 94.3%.
Pemberwick’s price per square foot is the lowest at $394/s.f. Part of this is that we have no new construction in Pemberwick that sold in 2018. The youngest house sold was 2001, followed by 1990 and the other 9 were all built before 1971. The change in the R-6 regulation from multi-family to only duplexes made new development here even more difficult as your land cost can only be divided over 2 units rather than 3 or 4 units.
Byram
| Section |
Byram |
| # Sold |
13 |
| Avg SP |
$2,369,031 |
| Avg DOM |
202 |
| Avg. SP/SF |
$543 |
| Avg of SP/OLP |
92.2% |
| Avg. SP/ASMT |
1.746 |
| Post 10/1/15 Appr |
23.0% |
| Post 2015 Construction |
0 |
In mid-2018, Byram had the highest average sales price as 207 Byram Shore Road sold for $17 million after 1,728 days on the market. At the end of the year, 13 houses had sold and if you exclude the four sales on Byram Shore Road, the next highest price was $760,000. Once again, we’ve seen no sales in Byram of recent construction. The youngest house sold was built in 1978 and the oldest at 37 Byram Shore Road goes back to 1690.
The blend of high-end waterfront and the good values in Byram north of I-95 leads to blended statistics. You would think that if one sale took 1,728 the average DOM would be way high, but most of the sales north of I-95 went to contract in 40 days or less, so we end up with the town-wide average of 202 days on market.
North Mianus
| Section |
North Mianus |
| # Sold |
10 |
| Avg SP |
$1,651,500 |
| Avg DOM |
116 |
| Avg. SP/SF |
$482 |
| Avg of SP/OLP |
91.7% |
| Avg. SP/ASMT |
1.881 |
| Post 10/1/15 Appr |
32.5% |
| Post 2015 Construction |
2 |
North Mianus has only a handful of sales, well OK two handfuls, with 10 sales, but four of them are 21st Century construction. The area is rapidly evolving and my client bought the highest priced house at $3.5M. It’s a beautiful house that borders Hillcrest Park without the higher cost there and should continue to appreciate as new construction in this area meets the needs of many successful younger families that are moving to Greenwich.
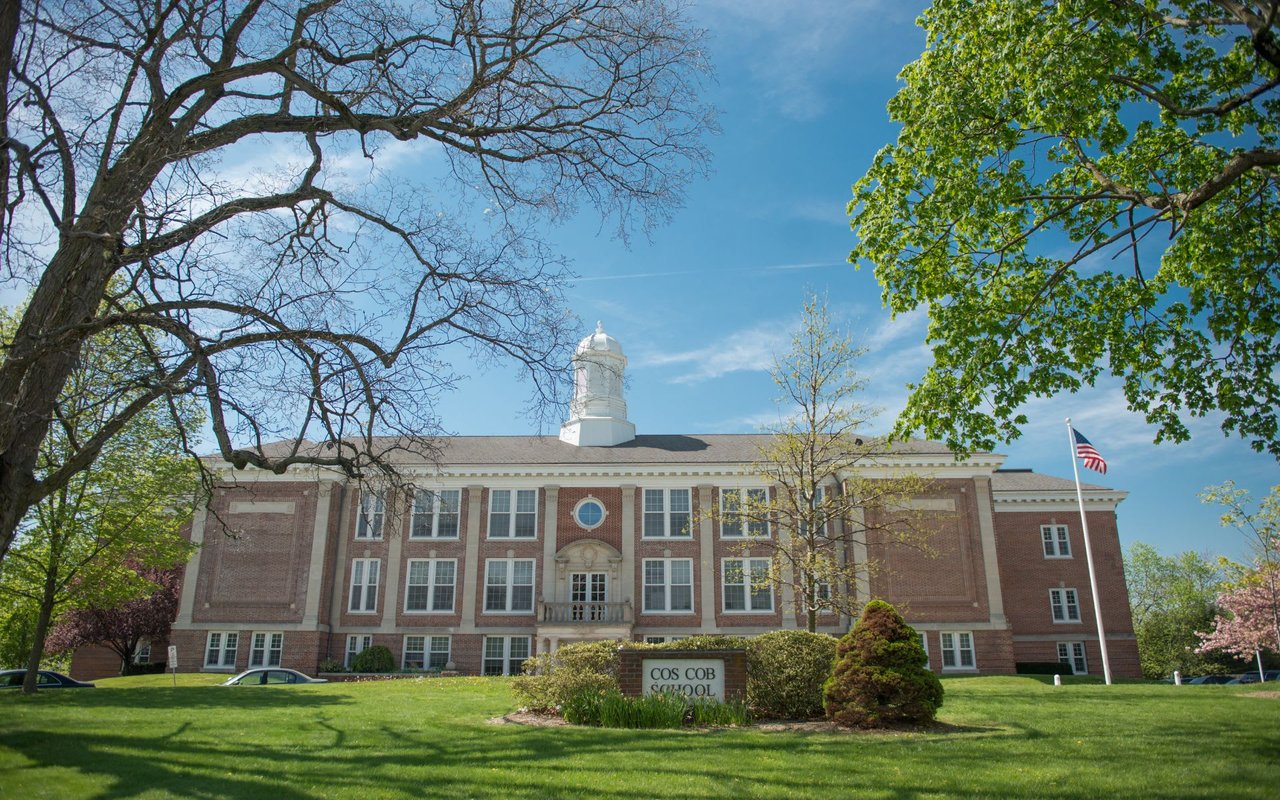
Cos Cob
| Section |
Cos Cob |
| # Sold |
75 |
| Avg SP |
$1,507,771 |
| Avg DOM |
168 |
| Avg. SP/SF |
$490 |
| Avg of SP/OLP |
92.6% |
| Avg. SP/ASMT |
1.749 |
| Post 10/1/15 Appr |
23.2% |
| Post 2015 Construction |
11 |
Cos Cob was a hot area in 2018. We had 75 sales up 17 from 2017. We also sold 11 houses built after our last revaluation. This is the most in any area of town, which is truly remarkable when you consider that geographically, Cos Cob is not that big a place. Days on market was good at 168 days compared to the 202 townwide average. The average sales price of $1.51 million was up $165,000 over 2017 and the sales price to original list price ratio was also the second highest at 92.6%.
Much of this is driven by $490/s.f. average, which is still a bargain compared to Old Greenwich and Riverside which are both over $600/s.f. The post 2015 appreciation could actually be a little better since it is biased upward by all of the new construction. Overall Cos Cob is a good place to invest.
Riverside
| Section |
Riverside |
| # Sold |
101 |
| Avg SP |
$2,426,776 |
| Avg DOM |
181 |
| Avg. SP/SF |
$603 |
| Avg of SP/OLP |
91.5% |
| Avg. SP/ASMT |
1.536 |
| Post 2015 Appr |
8.2% |
| Post 2015 Construction |
11 |
As anyone who has driven around Riverside has seen new construction is booming. I sold 151 Lockwood Road to the first buyer that saw it right after the first open house. He was developer waiting at the door when the clocked ticked over to 1:30 and the open house was over. It had been on the market less than 24 hours. Now, there are no easy sales in Greenwich anymore, so we had a hectic week of reviewing Planning & Zone regs, attorney negotiations and other issues, but the developer are looking in Riverside.
The surprising thing is that even with all the new construction, the total post-2015 appreciation is only 8.2%. A bunch of houses in Riverside, particularly in the R-7 zone sold for less than their FMV assessment. Many of these houses sold in the $800,000 to $1,000,000 range where sales went up because we had more inventory for once. It could be that these folks were particularly motivated sellers or it may be that prices just got to high. Having said that we had 101 sales up 7 sales from 2017.
Old Greenwich
| Section |
Old Greenwich |
| # Sold |
84 |
| Avg SP |
$2,185,546 |
| Avg DOM |
178 |
| Avg. SP/SF |
$618 |
| Avg of SP/OLP |
91.5% |
| Avg. SP/ASMT |
1.650 |
| Post 2015 Appr |
16.2% |
| Post 2015 Construction |
7 |
On the east side of town Old Greenwich has the “prize” for highest average price per square foot at $618/s.f. Having said that its still down from last year’s amazing $734/s.f. People really like to live in Old Greenwich (and Riverside). I have a client right now that needs to live in the Old Greenwich school district, where the average sales price is even higher average within Old Greenwich as whole. Her budget limits her to $1.5 million and we have less than a handful of options and they all need substantial work.
You can see the demand from the 178 days on market and average sales price of $2.19 million in an area without a one-acre zone. Once again this average price is down as we got more inventory below this average and those lower priced houses sold quickly. We also had good new construction with 7 spec houses selling, though Riverside had even more. Properly priced houses sell quickly in Old Greenwich.
Summary
Greenwich’s low taxes and the BET’s decision not to raise taxes this fiscal year clearly were a major plus for Greenwich housing sales they were up in 2018, when most of the surrounding areas were down. Byram, Cos Cob and North Mianus were all up. Old Greenwich, Riverside and South of the Post Road also saw sales increases, but it was a more nuanced story. Backcountry also has some things that are heartening with sales up albeit only one house, but this at a time when we had significant weakness in the $5 -10M market.
South of the Parkway/Mid-Country appears to have taken the major impact of the tax law changes in Washington and the uncertainty as to what is going to happen in Hartford. What did sell however was actually up slightly in price.
I’ve had several inquiries about people looking to sell their house in the spring market and if we can get Washington back to work it should be a decent spring market. Our last two months of 2018, we saw sales go up. Once again it should be an interesting, nuanced and complicated year and a good Realtor will make a significant difference.