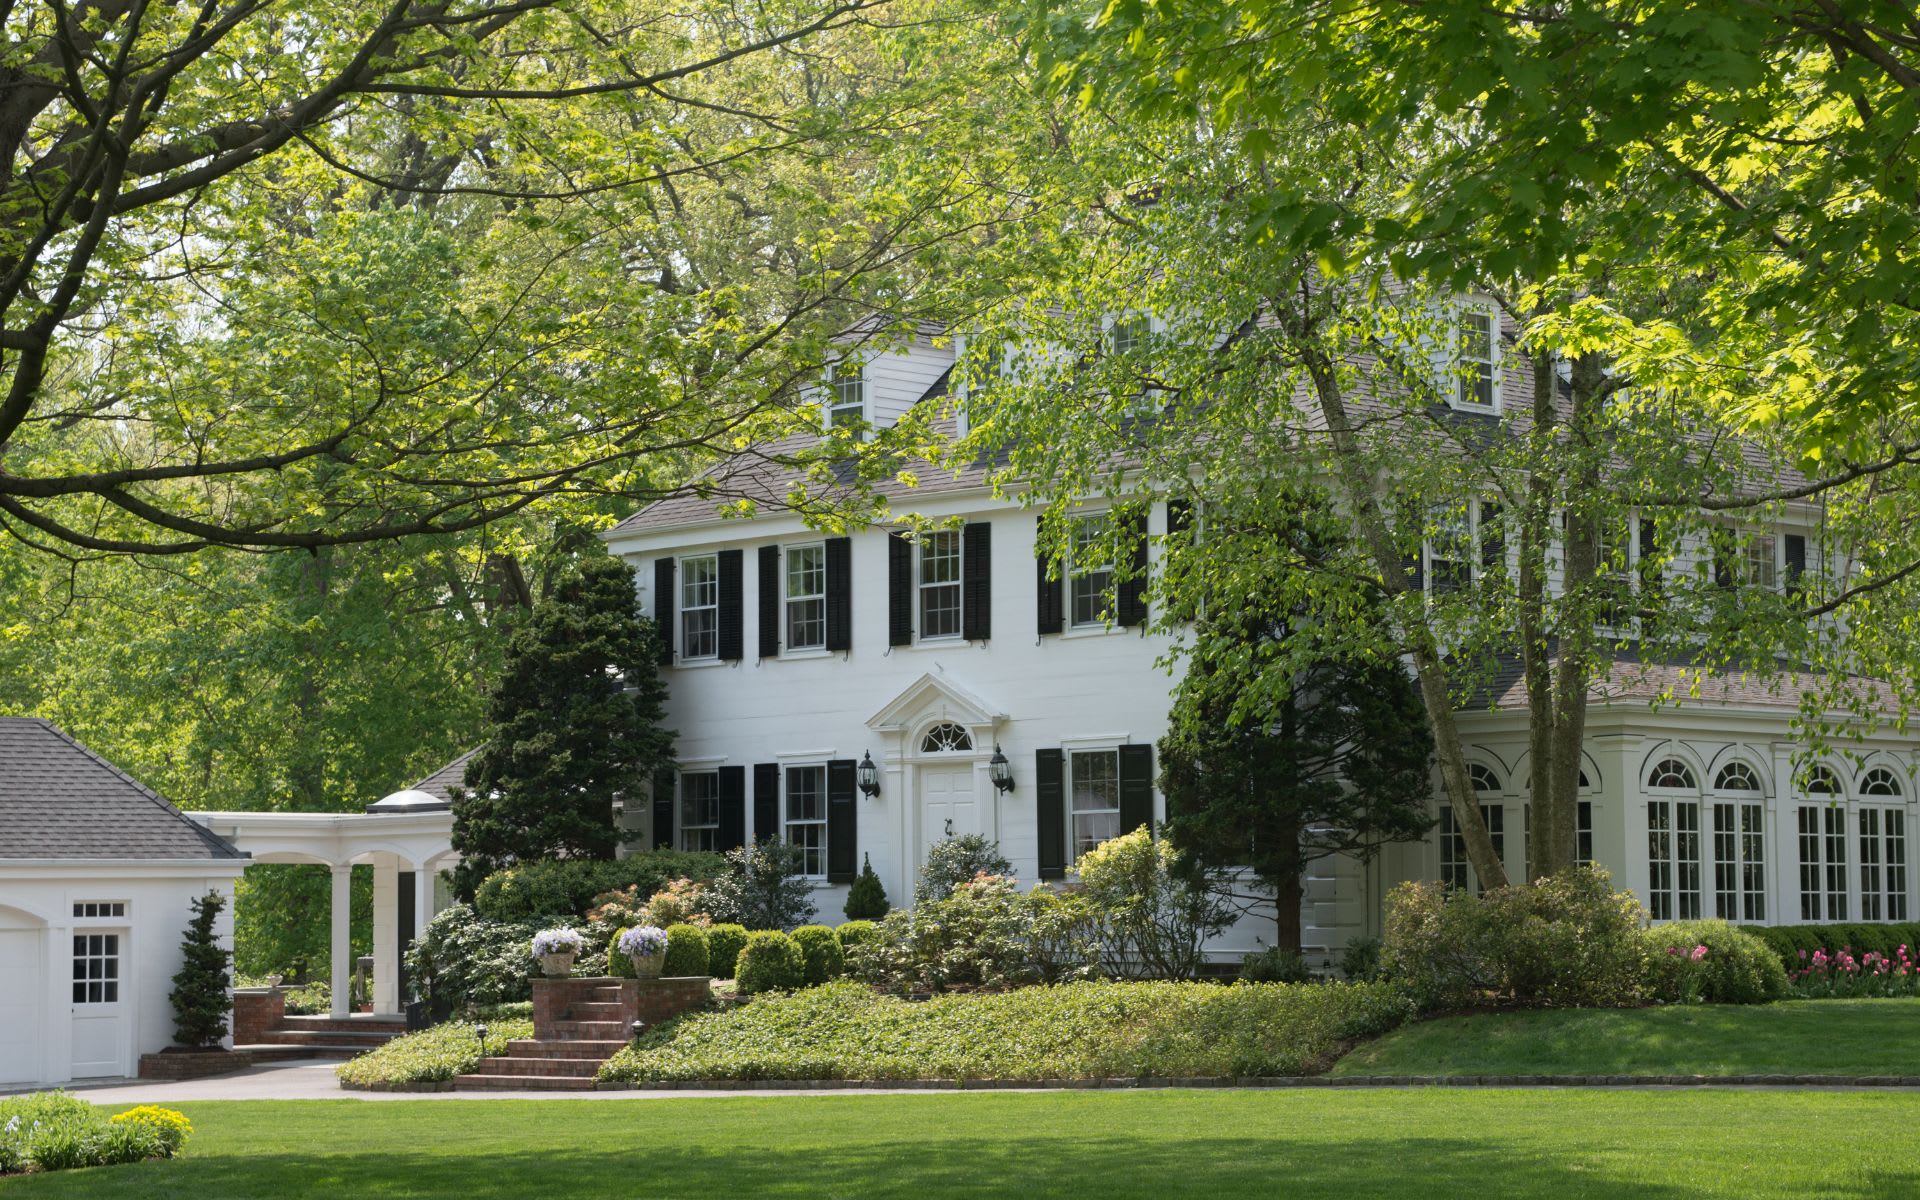
Let’s take a quick look at the neighborhoods from north to south in Greenwich and see how they have done in the last three months from April 30th through July 31st., but first let’s take a look at house sales in the whole town.
Totals & Averages
For the town overall, sales are up slightly from last year. We have had 199 sales in the last 3 months, since I last did a neighborhood report. These sales were boosted by a particularly good July this year. Our inventory is up by 44 houses all between $800,000 and $4,000,000 as the new tax law encourages our downsizers to move earlier than they might. August 2018 looks like it will be up a little from August 2017 when we had 57 single family home sales in Greenwich. Contracts are about the same as last year with 68 contracts outstanding. More on this next week when we have the final numbers.
Backcountry
Backcountry is showing some signs of perking up with an $11.1 million sale so far this year and an average sold price of $3,471,799 up $300,169 from the end of April. This is our highest average neighborhood price except for Byram (see below). Prices are also up since our last assessment in 2015, however we are still seeing the lowest townwide sales price to original list price ratio at 88%. We have had some remarkable discounts from what people paid pre-recession, which have garnered their share of attention. We also have 33 months of supply, but this is down from 79 months of supply when we had our spring inventory surge in April and sales had not caught up with the surge of spring inventory.
South of the Parkway
Now you might think of this “neighborhood” as mid-country, but it goes all the way from the Merritt Parkway to the Post Road. It has our most listings, 194, and our most sales, 93. Sales range from $725,000 to $12 million plus. This area has seen some nice improvement over the last three months with 47 houses sold during those three months. Inventory is down 17 listings; the most of any neighborhood. It also has had the most sales in the last 3 months, 47, and the biggest decrease in sold days on market, from 299 days to 247 days, though this is still above the townwide average. We also are seeing a good 14.6 months of supply in a market that was not doing nearly as well at this time last year.
South of the Post Road
Listings 63
Percent of Market 10%
Listing DOM 209 days
No. of Sales 33
Sold DOM 199
Average Sales Price $2.43M
Sales Price/S.F. $718
Months of Supply 13.4
This area also covers a wide variety of price ranges, as it covers from Belle Haven to Chickahominy. As a result, the sold prices range from $515,000 to $9,245,000. The area around Greenwich Avenue continues to be very busy. We also have a fair amount of construction going on particularly of condos, but this condo construction will slacken off as the recent R-6 zone revisions reduces demand for developable land in this zone. The waterfront sales give this section the highest sold price/s.f. at an average of $718 s.f. for houses, with the new construction in the downtown helping also. This leading number however is down from $754/s.f. through April of this year. This could be just a change in the sales mix, or slight lessening in demand in an area that has seen more appreciation than some other areas. It is worth monitoring going forward.
Cos Cob
Listings 46
Percent of Market 7%
Listing DOM 198 days
No. of Sales 45
Sold DOM 161
Average Sales Price $1.60M
Sales Price/S.F. $500
Months of Supply 7.2
Cos Cob is busy. So far this year we have had 45 sales through the end of July with 46 listings looking for buyers as of this week. This represents 7% of our total inventory. This neighborhood has also seen the most appreciation based on a sales price to assessment ratio of 1.85 or a 30% increase since October 2010, when the last reassessment was done by our Tax Assessor. Part of this popularity is the average sales price of $1,598,812 is where we usually see the most sales activity. Unfortunately this year, the $1.0 – 1.5 million price range has been the area where we have seen the most impact from the new federal tax law, but it doesn’t seem to have hit Cos Cob as much as other areas in town (which is good as I have a listing coming on in the downtown Cos Cob area for a very competitive $749,000.)
Riverside
Listings 92
Percent of Market 14%
Listing DOM 192 days
No. of Sales 62
Sold DOM 177
Average Sales Price $2.45M
Sales Price/S.F. $598
Months of Supply 10.4
While Cos Cob is only about 7% of our market, Riverside and Old Greenwich are both about twice that. We have seen lots of good appreciation in this area post-recession, as Riverside has become one of the most desirable neighborhoods in the entire NYC metro area for successful young families. There are some signs that the pace of this appreciation is slowing as Riverside’s price per square foot is almost $600. Riverside still has a better than average days on market of 177 DOM compared to a town wide average of 208 DOM. People still love Riverside, they just love it a little less at these prices.
Old Greenwich
Listings 81
Percent of Market 13%
Listing DOM 191 days
No. of Sales 52
Sold DOM 174
Average Sales Price $2.34M
Sales Price/S.F. $615
Months of Supply 10.9
I grew up in Old Greenwich and never saw that much difference between Riverside and Old Greenwich. Statistically, that is also true this year. Riverside has a slightly higher average price, but OG can claim a slightly higher price per square foot. The both have the same sales price to original list price ratio at 0.93, which is above the townwide average of 0.91. Things seem to have gone from hot to warm for these two areas as they both have over 10 months of supply.
Glenville
Listings 20
Percent of Market 3%
Listing DOM 148 days
No. of Sales 21
Sold DOM 219
Average Sales Price $1.09M
Sales Price/S.F. $411
Months of Supply 6.7
Glenville has a lot in common with Cos Cob they both had months of supply around 7 month with Glenville having 6.7 months.. It’s a place where people are finding what many call a good value and sales are doing well in Glenville. The average price per square foot is a reasonable $411 and the average sales price is $1,092,976. That average sales price per square foot is our lowest of any neighborhood. (Well, OK, Banksville is lower at 4313/s.f., but its only had 1 sale so far this year and 4 listings.) Glenville Elementary has had a significant part of this. It’s a modern, well-designed, well-run school that has made this area more desirable.
Pemberwick
Listings 6
Percent of Market 1%
Listing DOM 150 days
No. of Sales 8
Sold DOM 131
Average Sales Price $643K
Sales Price/S.F. $413
Months of Supply 5.3
I wish people didn’t like Pemberwick so much, then we Realtors would have more houses to sell. We only have 6 houses in inventory; we have sold 8 Pemberwick houses so far this year. It ties Glenville for our lowest price per square foot, since unlike Byram, there isn’t an ultra-high-priced area that skews the numbers. Pemberwick also has the lowest days on market and the highest sales price to original list price ratio in town. If they only had more turn over it would get more attention.
Byram
Listings 15
Percent of Market 2%
Listing DOM 121 days
No. of Sales 5
Sold DOM 369
Average Sales Price $3.85M
Sales Price/S.F. $585
Months of Supply 21.0
Byram is small part of our inventory, but now holds the record for the highest sales price this year at $17,000,000. This sale also led to Byram having the highest average sales price for any neighborhood, $3,845,100. Byram also has the lowest priced sale this year in Greenwich at $408,000. What we have are really two markets in Byram; north of I-95 we have a market much like Pemberwick where listings are few compared with demand and prices are mostly below $1 million and often well below. South of I-95 in the Byram Shore area most prices are over $3 million and houses tend to linger on the market. The result is some confusing numbers if you don’t’ consider this market dichotomy.
The question is what will the fall market bring? We can be pretty sure there will be some rings some surprises. Lately, my listings have been getting more showings so I’m hoping the changes will be in the positive direction. I’ve got four listings coming on in the next two weeks and can’t wait to see what that market is going to bring.