How is Your Greenwich Neighborhood Doing in 2021?
May 2021 was a Dickensian month. It started out as the best of times and while it didn’t quite end as the worst of times, we won’t from possibly the best week ever in Greenwich with 85 transactions to 45 transactions by the end of the month. Having 45 transactions (sales and new contracts) in one week actually isn’t a bad week, it just that by the end of May it looked the Greenwich real estate boom might be over.
Well, the short answer is that June transactions show it’s not, though it’s not quite as good as it looks. The first two weeks of June, we had 57 and 55 transactions and then last week we jumped up to 72 transactions. That exceeds the highest number of transactions that we had in our best weeks in 2020, which itself was a record year.
The 72 transactions we had last week is 6% over the best week of 2020, but the details show it’s a maturing market. When we set the record of 85 transaction in the first week of May, we had 57 contracts and 28 sales or 2:1 ratio of contracts to sales. Our 72 transactions last week were in a 1:1 ratio of sales to contracts with 36 contracts and 36 sales. That ratio is actually fairly normal as June is typically our month with the most sales and contracts start to fall these deals close.
What we actually may be seeing is normal on steroids with more sales each month, but a more typical annual sales curve. In the first 20 days of June, we’ve had 82 sales which is very impressive given that our 10-year average for June sales in 86 single family home sales. If you gross up those 82 sales for the whole month, you’d be looking at new all-time June record of 120 single family home sales.
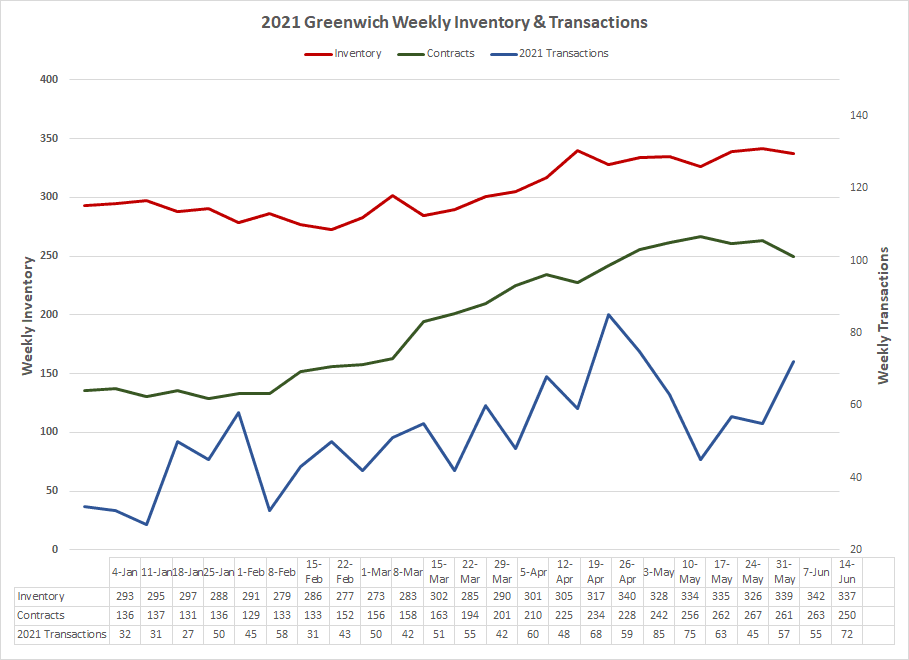
I wouldn’t hold my breath, but it’s a definite possibility that June 2021 could be third all-time, consecutive record sales month after April and May 2021 (and February 2021 also). Having said that the general consensus among agents is that market is going from frenzied to just hot, and you can see that when you look at total contracts. In the third week of May we peeked at 267 contracts waiting to close. We are now down to 250 contracts, which is still very good, but we have had 4 weeks of a flat to slightly down trend. This is what happens every year, just not at these levels, as the spring contracts mature into summer sales.
The Neighborhoods
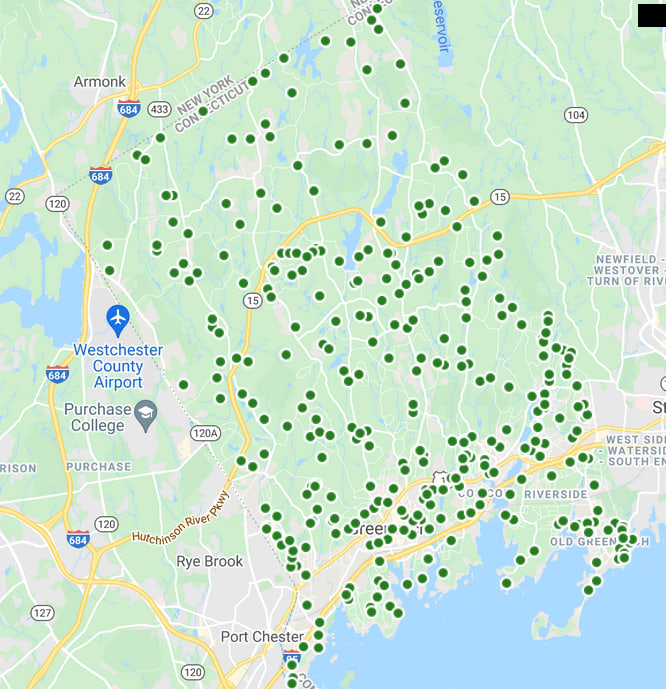
So where are all the sales? The answer is everywhere. If you look at a map of our sales in Greenwich it looks like a we have blue measles with major concentrations in Old Greenwich, Riverside, central Greenwich, Glenville and Pemberwick, and not so much in north Greenwich, but what the map doesn’t show is zoning. All of our “busiest” areas are also the areas that are mostly half-acre and smaller zones. In an R-7 zone (7,500 s.f.) you get 6 sales per acre or 24 sales per 4 acres.
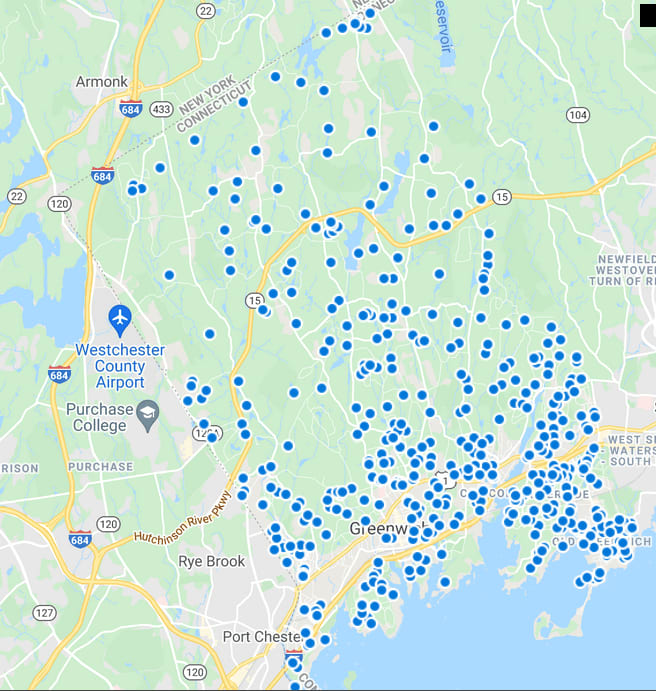 Sold YTD mid-June 2021
So north of the Merritt Parkway take the dots and multiple by 24 times in the four-acre zone and 8 times in the two-acre zone south of the Merritt Parkway. If you do that, backcountry, and particularly mid-country, are doing better than the hot front country, but will that continue?
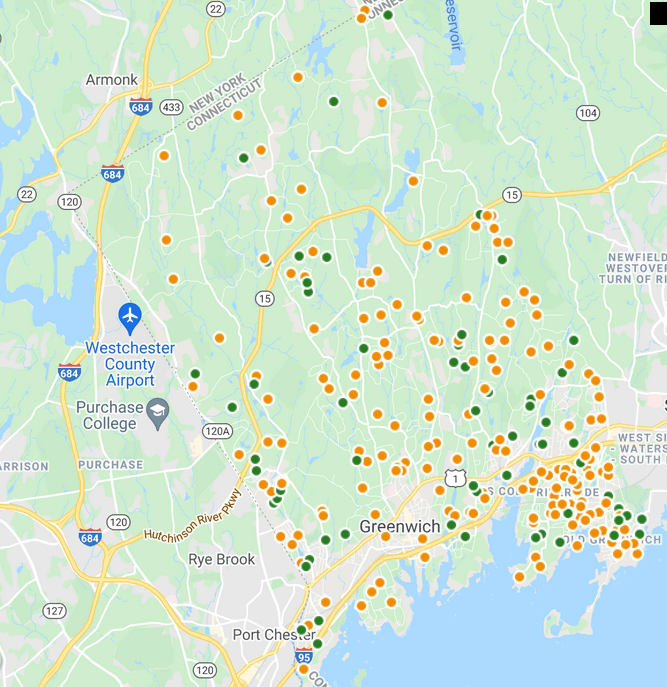 Contracts mid-June 2021
The best indicator of how each area will do over the next couple of months is the number of contracts and there Old Greenwich and Riverside stand out as they have 85 of the 250 contracts waiting to close. The other thing you see is the grouping of contracts along our western border with New York. It’s not only Covid buyers from New York City, but also a fair number of buyers from Rye and other Westchester town that want a short drive to their relatives and former neighbors.
Actives
The other factor that’s having a big impact on sales this year is inventory. We have 3.5 months of supply and if you throw in those 250 contracts that are waiting to close, we have a super tight 2.8 months of supply. It looks like inventory is going to limit sales in Old Greenwich, and particularly in Riverside where we only have 26 listings with only 10 of those south of the Post Road. The other thing we are seeing is some pushback on prices as we saw in 2018, when we saw sales spurt in Cos Cob and Glenville as prices per s.f. in Old Greenwich and Riverside appreciated too rapidly for many prospective buyers.
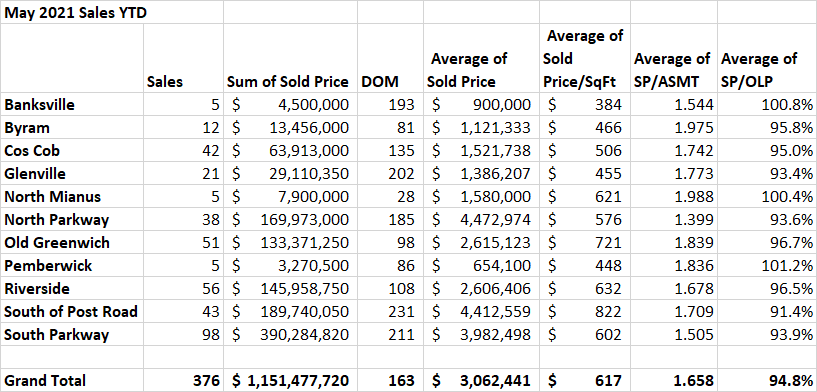
This year has been an amazing year for Greenwich real estate. Our sales are up nearly 100% from 191 sales through the end of May 2020, to 376 sales this year. Our average sold price is up $932,951 to $3,062,441 from $2,129,489. This is a jump of 44%, but that doesn’t mean that your house went up 44% in the last year.
The huge jump in the average price is more of a mathematical curiosity, than a useful number when it comes to buying a house or refinancing. It is a real number and can be used when talking to your father in NYC or your brother in Silicon Valley or your sister in south Florida, since they are probably reading about average price changes in their states.
Four things are driving the average price change. First people want bigger houses. The median size of a Greenwich house sold in 2021 so far is 4,242 this is 573 square feet bigger than the median size for 2019. Arguably, 16% percent of the 44% average price increase is due to larger houses.
Second, we are seeing some inflation as the Washington continues to pour money into the economy and keep interest rates artificially low. Estimates put Y-o-Y inflation at over 4% through April. Third, are our base comparison issues. All these year over year numbers are comparing a very robust first 5 months in 2021 to two and half months of recovery in early 2020 and 2 and a half months of lockdown after the mid-March 2020 lockdown. Lastly, we are seeing real appreciation driven by increased demand for houses while at the same time we have decreased supply. Sales are up 97% while inventory is down 45%.
A better way to look at this price appreciation is by comparing either the sales price per square foot or the ratio of sales price to the tax assessor’s assessment. When you look at the sales price per square foot, we are up 26% townwide. If you look at the sales price to assessment ratio, we are up 16% year over year.
So how much have properties appreciated in Greenwich in the last year. Well, it’s kind of like the old lawyer joke. When the retiring CEO was interviewing for a successor, he asked his general counsel what is two plus two. The GC’s response, “What do you want it to be?” Our appreciation is like that. All of these numbers are mathematically accurate, they just measure price appreciation in different manners. One thing you can be sure of is, is that when all three factors are up, we are looking at real appreciation.
Greenwich Neighborhoods Booming and Boomlets
If the CEO were to ask his COO/property manager what is 2+2 is response might be, “Well where are we talking about.” While our townwide average SP/Assmt ratio is up 16% Y-o-Y, in Glenville and Cos Cob, we are looking at 26% and 21% increases respectively. These are the areas that didn’t do well in 2019 as the SALT tax deduction limitations impacted Greenwich and their recovery looks bigger as it’s off a smaller base.
The other major area with above average appreciation this year is Backcountry where the SP/Assmt ratio is up 18% Y-o-Y. Backcountry was a major beneficiary of the Covid driven lifestyle. If a buyer wanted the much desired mini-country club with pool, tennis court and basketball court/enlarged parking area; it’s a lot easier to do that on 4 acres rather than two acres.
Our Neighborhoods Leaders
Greatest Y-O-Y Appreciation ($/sf) – Backcountry
Backcountry posted a 51% gain on price per s.f. This astounding number is a lot of real appreciation along with some big sales at a premium price per square foot. In second place was South of the Post Road, where we are some big waterfront sales and some real volatility in the high-end market. We have a bunch of folks putting their house on the market and bunch of people buying them almost as fast as they come on.
Greatest 6-year appreciation (SP/Assmt) – Byram
Byram has some of our most affordable housing. It got hammered in the recession, but since the assessment it has come back strongly up 39% since our last assessment date of October 1, 2015. In fact, so strongly, that it’s up only 4% this year as there are good deals in other parts of town. (North Mianus actually did better but with only 5 sales and the same with Pemberwick.) Old Greenwich continues to do well as it does year in and year out. Since 10/1/05, OG has racked up 30% appreciation.
Biggest percentage increase in sales
Byram once again does very well here as does Banksville. In the larger neighborhoods South of the Post Road saw a 187% jump in sales in the first five months of the year. Backcountry was up 124%. (Backcountry is back.)
Biggest Sales Volume Increase
South of the Parkway our biggest GMLS neighborhood saw sales jump by $234 million from $156 million to $390 million in sales. Coming in second was South of the Post Road where all the move-outs allowed a lot of move-ins resulting in an increase of $142 million in sales.
Overall, it’s a hot year and we are staying at a very busy level.