Election Over: Greenwich Real Estate Sales Up - 12/09/2018
Mark Pruner
|
December 8, 2018
SHARE
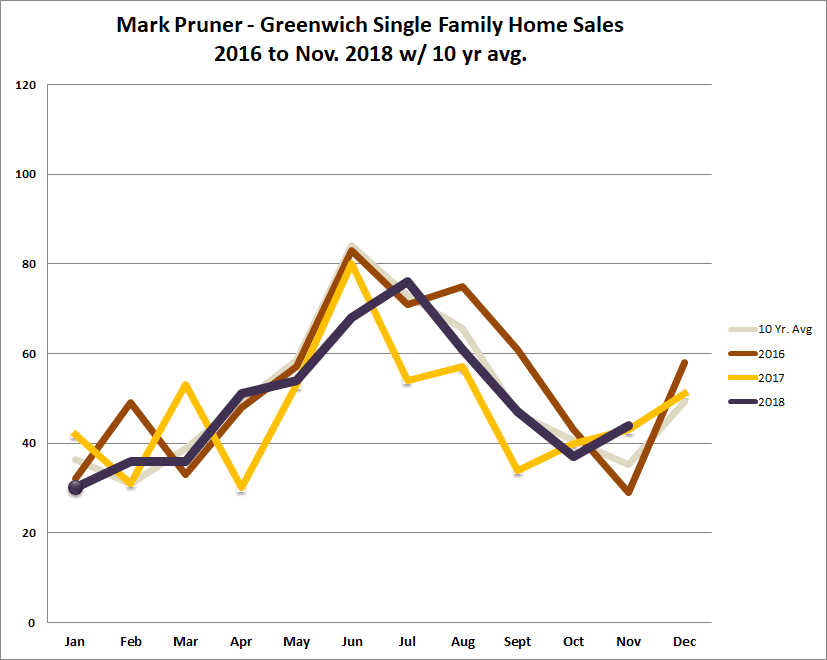
November 2018 – The New Normal Returns
Single-family home sales were up 9 sales over our 10 year average or 25% higher. Our average sale was $2.45 million and our median sales price to original list price was 92%. The price range from $800,000 to $1 million was particularly strong with sales up 5 sales for the month and 21 sales for the year, but may not continue that way.
For much of 2018, the TaxCut and Jobs Act was shaping our market. We saw more inventory at just aboutall levels, more sales at the high end, and fewer sales in a tight bracketbetween $1M and $1.5M. Inventory went up, as people who were retiring andthinking about moving in the next couple of years decided that the first threequarters of 2018 was a good time to list their house.
As of 12/1/18
Inventory
Contracts
Last Mo. Solds
Tot. Solds+ Contracts
YTD Solds
YTD+ Contracts
Mos Supply
Mos w/ Contracts
Last Mo. Annlzd
< $600K
2
3
0
3
12
15
1.8
1.7
–
$600-$800K
10
5
4
9
43
48
2.6
2.6
2.5
$800K-$1M
19
9
11
20
64
73
3.3
3.3
1.7
$1-$1.5M
49
16
6
22
98
114
5.5
5.4
8.2
$1.5-$2M
67
11
7
18
92
103
8.0
8.1
9.6
$2-$3M
114
13
8
21
99
112
12.7
12.7
14.3
$3-$4M
71
9
6
15
61
70
12.8
12.7
11.8
$4-$5M
54
2
1
3
28
30
21.2
22.5
54.0
$5-6.5M
56
3
1
4
26
29
23.7
24.1
56.0
$6.5-$10M
46
2
0
2
9
11
56.2
52.3
–
> $10M
32
1
0
1
8
9
44.0
44.4
–
TOTAL
520
74
44
118
540
614
10.6
10.6
11.8
Inventory & Sales
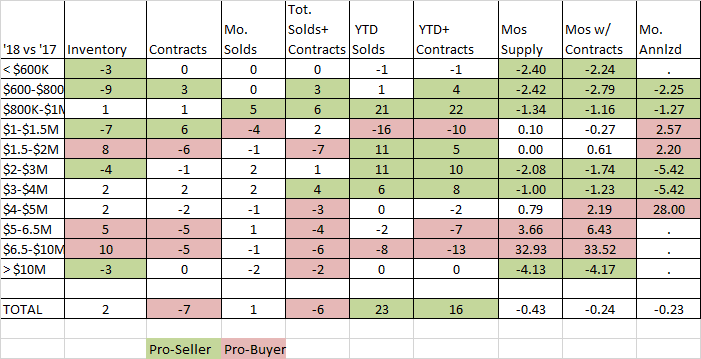
Much of the TCJA effects seemed to run its course. As of the beginning of December, our inventory is nearly identical to last year, 520 single family homes versus 518 homes last year. Whereas earlier this year we had more inventory below $1.5 million now inventory below $1.5 million is down 18 houses or 18% compared to last year. This is particularly remarkable since earlier we’d had a big spike in inventory from $1 – 1.5 million, now it actually down 7 listings from last year.
We do have more inventory from $5 – 10 million which is the segment that our governor-elect really needs to worry about as these folks pay lots of taxes.
On the sales side we are up in nearly every price range from $600,000 to $4 million. The one exception is from $1 – 1.5 million where the TJCA caused headaches from earlier this year. We are still down 16 sales for the year, but as mentioned contracts are up in this price range.
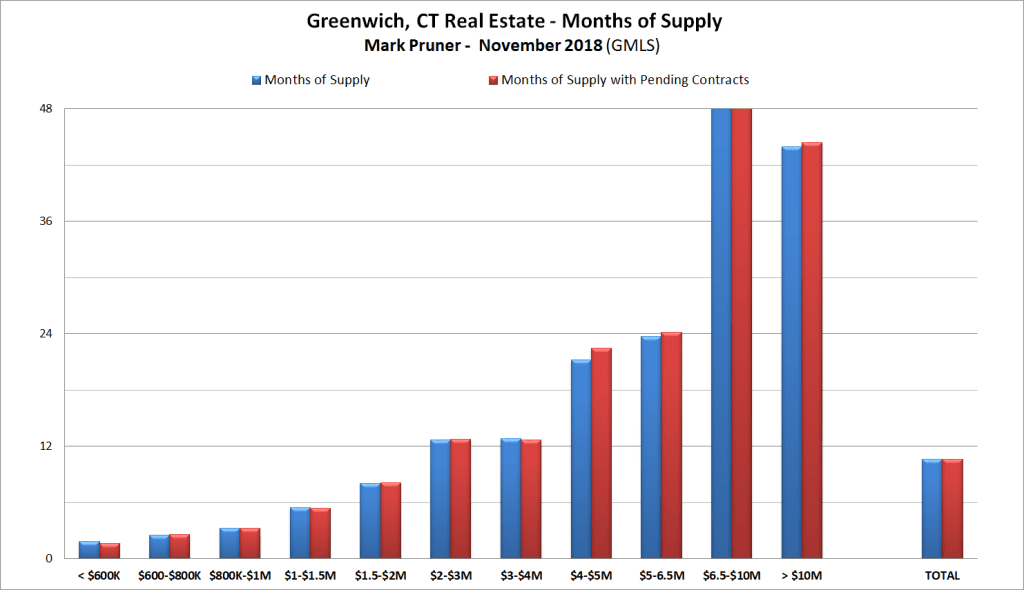
As noted in the $5 – 10 million price range where we have 15 more houses in inventory, we also are down 10 sales over last year. More inventory and fewer sales means a jump in months of supply. We are up 3.7 months of supply in the $5 – 6.5 million to 24 months of supply. While that shows a slow market, the real problem is from $6.5 – 10 million where months of supply have increased a very worrisome 33 months to 56 months of supply or 4.7 years of supply.
$800,000 – $1,000,000 – A sweet spot for sales.
Earlier in the year, we had seen a bump in inventory from $800,000 to $1,000,000, but that was actually good news. Who doesn’t want to buy a house in Greenwich for less than $1,000,000. The numeric answer is 21 more homeowners do. This equates to 49% more sales from $800K – $1M or 43 sales last year and 64 sales this year.
The further good news for Connecticut and Greenwich is that many of these new homeowners were younger families who needed to buy lots of stuff, to fill up their new house after living in a small apartment in NYC. We also had downsizers from Westchester who had the funds to fix up their new homes, something that is less popular among younger families who generally prefer as close to move-in condition as they can get. It’s nice that we could welcome them all to Connecticut.
$1.0 – 1.5 Million – Getting Better
As I said earlier in the year, we saw more inventory and fewer sales from $1.0 – $1.5 million, but that has now reversed itself. Inventory in this price range is down 14% and contracts are up 60% over last year. We are still down 14% in sale or 16 fewer houses sold this year compared to last year, but with contracts up 60% we will continue to catch up in this price range.
The $4 Million Discontinuity
Whether you look at months of supply or year or year sales or several other factors one thing that stands out is the difference in the market above and below $4 million. Below $4 million we have about a year of supply and this continues all the way down to $2 million. Above $4 million we have almost two years of supply and that continues up to $6.5 million. So, we have two distinctly different markets.
Months of supply have two components, sales and inventory, so as we saw sales are about the same for sales above and below $4 million whether in backcountry or OG-R. What is different is the inventory. We have more high-end inventory in backcountry and mid-country and that is what is raising the months of supply for the $4 -5 million range. And, it’s mostly the increase in the $4 – 5 million inventory south of the parkway that is causing this discontinuity.
In total from $3 – 5 million we have 130 listings and 59 of the listings are south of the parkway or 45%. At the same time we have 98 sales through the end of November and only 34% of the sales are south of the parkway. The other standout is Cos Cob where 7 properties priced from $3 – 4 million have sold so far this year and another sale is pending with only one listing presently available for sale. So, more Cos Cob sales from $3 – 4 million along with more mid-country inventory from $4 -5 million explains much of the difference numerically.
We are a dedicated group of Greenwich natives. We have a deep passion for our hometown and enjoy everything the town offers its residents from the beach front to the backcountry. That is why we don’t find you just any home, we find you the right home.