Market Stays on Track
|
As of 3/7/18
|
Inventory
|
Contracts
|
Last Mo. Solds
|
Last Month Solds+ Contracts
|
YTD Solds
|
YTD+ Contracts
|
Months of Supply
|
MoS w/ Contracts
|
Last Mo. MoS Annlzd
|
| < $600K |
1 |
0 |
2 |
2 |
4 |
4 |
0.5 |
0.9 |
0.5 |
| $600-$800K |
13 |
5 |
1 |
6 |
7 |
12 |
3.7 |
3.8 |
13.0 |
| $800K-$1M |
17 |
10 |
4 |
14 |
7 |
17 |
4.9 |
3.5 |
4.3 |
| $1-$1.5M |
64 |
14 |
3 |
17 |
8 |
22 |
16.0 |
10.2 |
21.3 |
| $1.5-$2M |
73 |
14 |
8 |
22 |
10 |
24 |
14.6 |
10.6 |
9.1 |
| $2-$3M |
111 |
16 |
10 |
26 |
14 |
30 |
15.9 |
13.0 |
11.1 |
| $3-$4M |
71 |
12 |
4 |
16 |
6 |
18 |
23.7 |
13.8 |
17.8 |
| $4-$5M |
52 |
5 |
2 |
7 |
3 |
8 |
34.7 |
22.8 |
26.0 |
| $5-6.5M |
47 |
9 |
0 |
9 |
2 |
11 |
47.0 |
15.0 |
– |
| $6.5-$10M |
41 |
3 |
0 |
3 |
1 |
4 |
82.0 |
35.9 |
– |
| > $10M |
34 |
1 |
1 |
2 |
3 |
4 |
22.7 |
29.8 |
34.0 |
| |
|
|
|
|
|
|
|
|
|
| TOTAL |
524 |
89 |
35 |
124 |
65 |
154 |
16.1 |
11.9 |
15.0 |
We had 35 sales in February, which is 4 sales above our 10-year average of 31 sales. February 2018 looks a little better after a slightly below average January. This up and down pattern has become the norm for the last few years. While our 10-year average sales line approximates a nice sine wave with peak sales in June and our low point in in February, the market today jumps around from month to month, particularly in the first quarter.
On the contract side in March 2018 we had 89 contracts at the beginning of the month which compares to 86 contracts at the beginning of March 2017, which was one of our better Marchs for sales. Now this contract activity is actually somewhat surprising given the three nor’easters that we have had. (Though I must say this last nor’easter was a bust here in Greenwich and didn’t really deserve the name, more of a bor’easter.) If we get some truly spring like weather, we have may see a nice turn out of buyers at open houses.
We are certainly seeing enough open houses. Last weekend we had 85 open houses listed on my weekly open house email and the weekend before we had an amazing 92 open houses. I think that may be a record for that early in the year.
The open house trend is expanding for a couple of reasons. We are seeing more open houses on Saturday and more open houses for listings over $5 million. Open houses are also a way for sellers to reach out to unrepresented buyers.
What used to just be only a trickle of unrepresented buyers is now becoming a significant part of the market. You see unrepresented buyers particularly at the low end, but even at the very top people are exploring open houses without having spoken to an agent. Now this is growth is particularly curious, because the buyer doesn’t pay the sales commission, the seller does.
Some people, usually attorneys, say that the buyer does pay the commission, since commission comes out of the sales proceeds that come from the buyer. The commission is part of the original listing agreement, which was signed and fixed long before the buyer showed up. As a result, it doesn’t cost the buyer any more to use an agent. Most buyers in Greenwich do end up using a buyer’s representative agent for the latter parts of their new home acquisition process, but using an agent earlier in the process can be very helpful and time-saving.
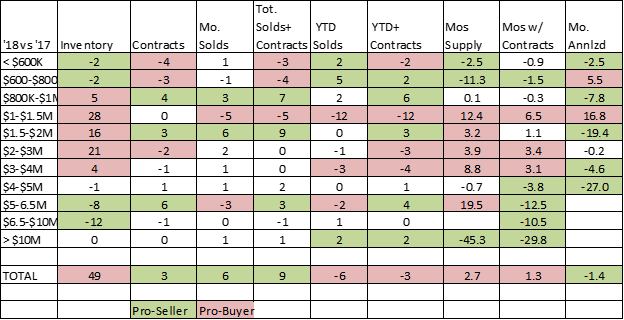
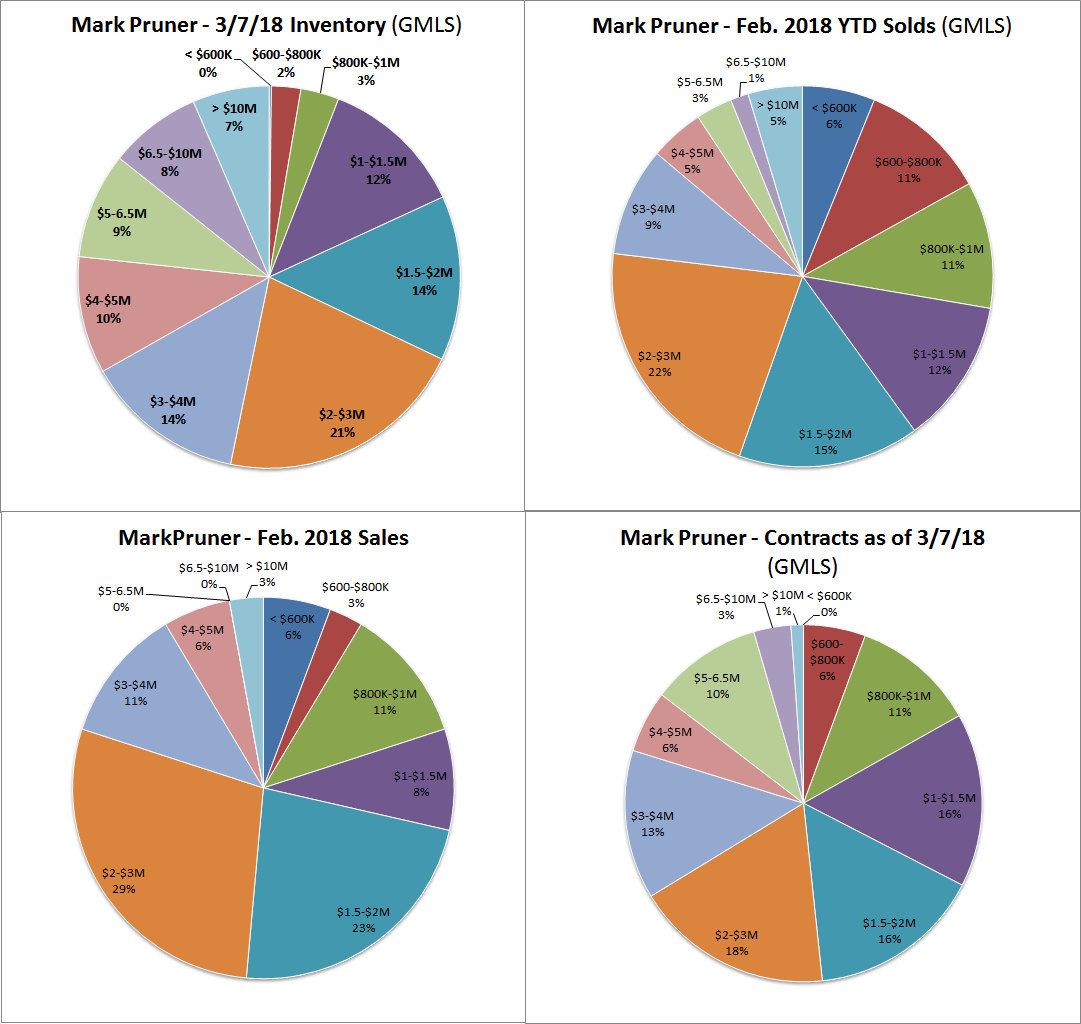
As to the market itself, when you compare this February to last February some definite trends show up. The biggest one is the early season jump in listings between $1 million and $3 million. This is a trend to more inventory in this price range is a carryover from the second half of last year.
Last year we also saw slightly slower sales from $1.5 – $3 million. So far this year the sales from $1.5 – $3M have picked up while the next price bracket down from $1 – 1.5 has seen lower sales in the first two months of 2018. The result of the higher inventory and slower sales in this price range is that we have practically the same months of supply from $1 million to $3 million at 16 months of supply.
Now 16 months of supply is a lot of supply in the price ranges where we have the most listings, but no need to panic just yet. Sales are uneven in the first quarter and that’s when see the spring inventory start to come on the market, so months of supply always go up this time of year, but is this year’s jump an effect of the new tax law? It is too early to tell, but it does bear watching in the upcoming months. (Conversely, I just had a multi-buyer bidding war for that price range, so there are buyers out there for the good listings.)
In the market below $1 million dollars sales are down, but this is principally due to a lack of inventory. Below $600,000 we only have 1 listing and we had 2 sales last month. In that price category we have 2 weeks of supply. Over $5 million, inventory is down significantly, possibly due to the cold, snowy weather, but total sales and contracts are up, so our high-end improvement is continuing.
So, all in all we have a market that is moving along just not all at the same pace.


