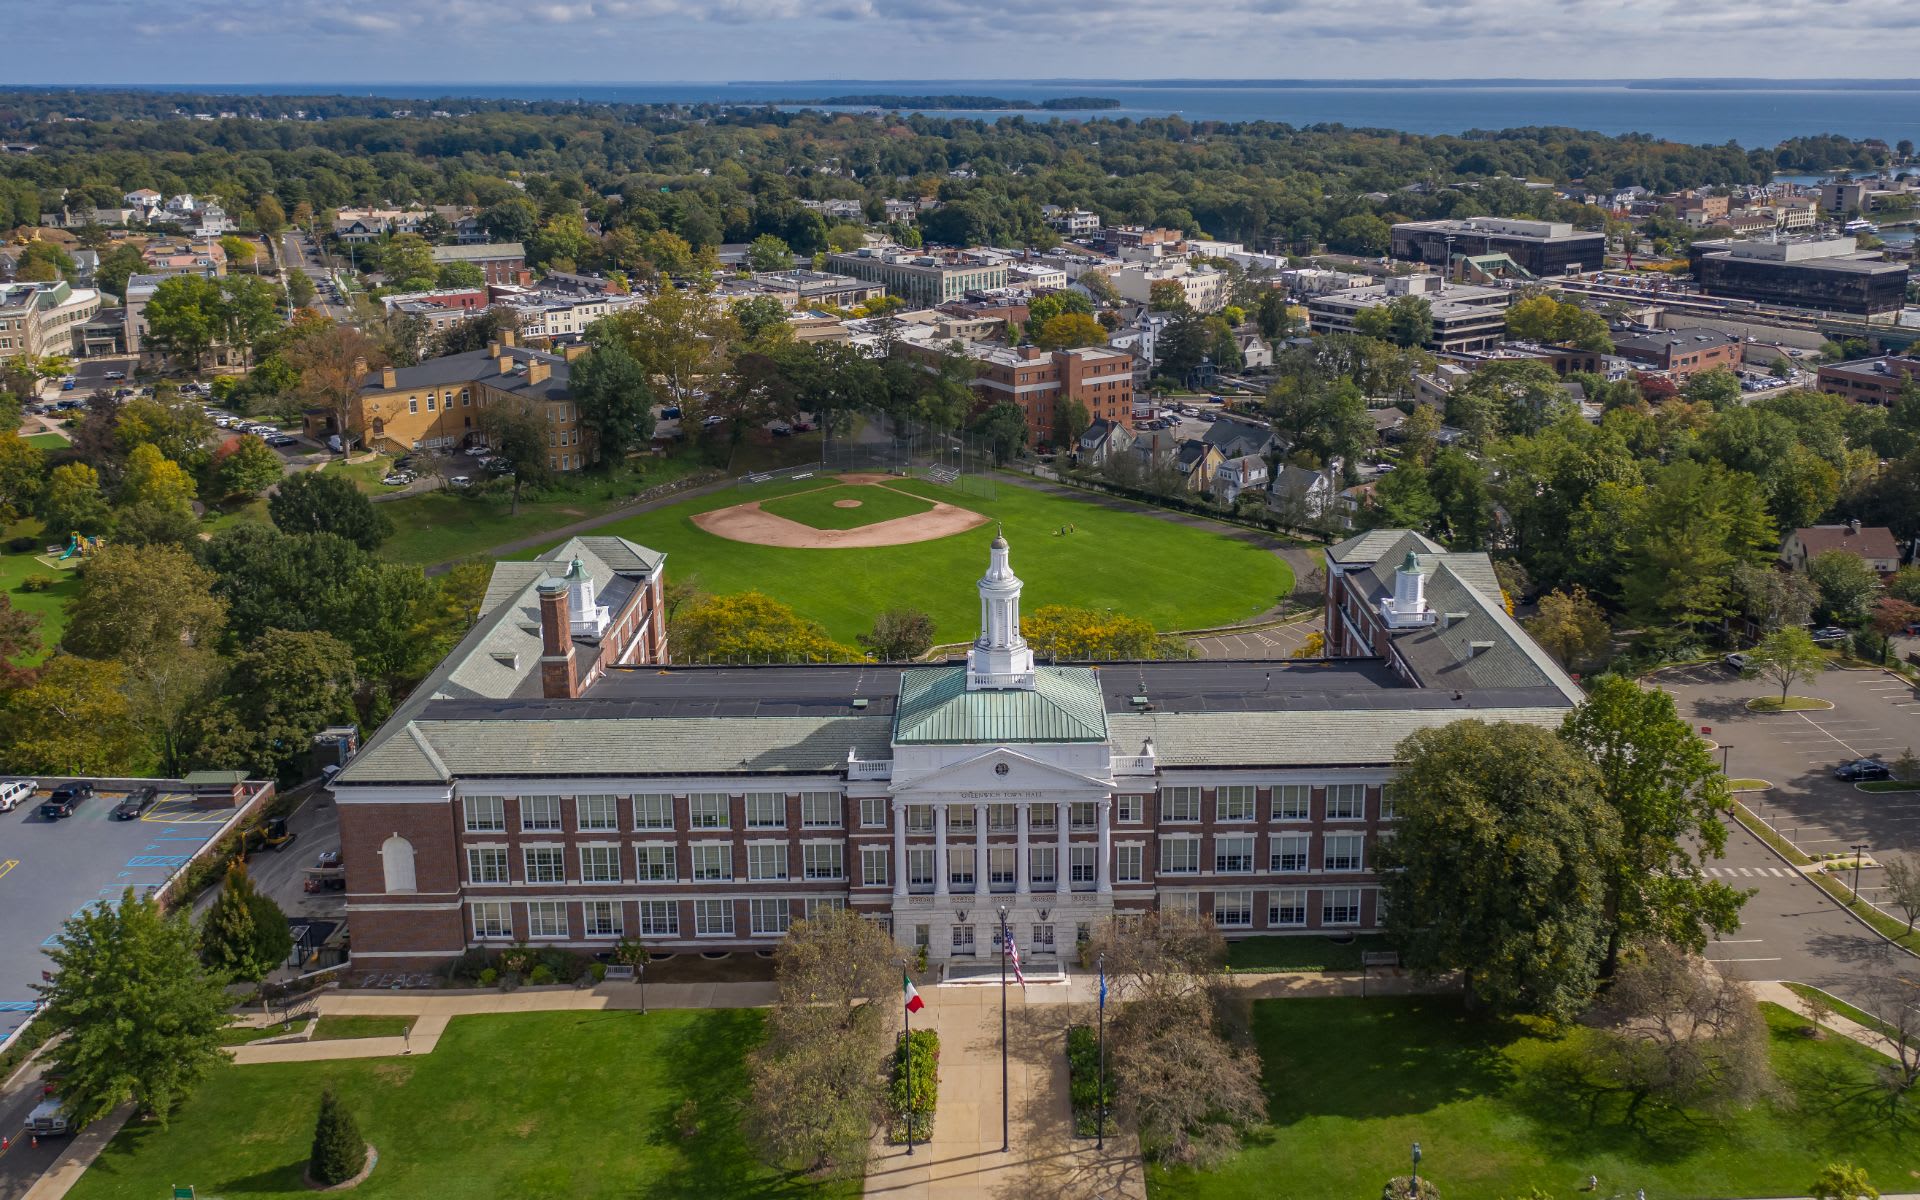
Greenwich 2022 Real Estate Sales by School Districts
Mark Pruner January 12, 2023
Mark Pruner January 12, 2023
Greenwich 2022 Real Estate Sales by School Districts
Some Stats Up in Every District but Not Every Stat in Every District
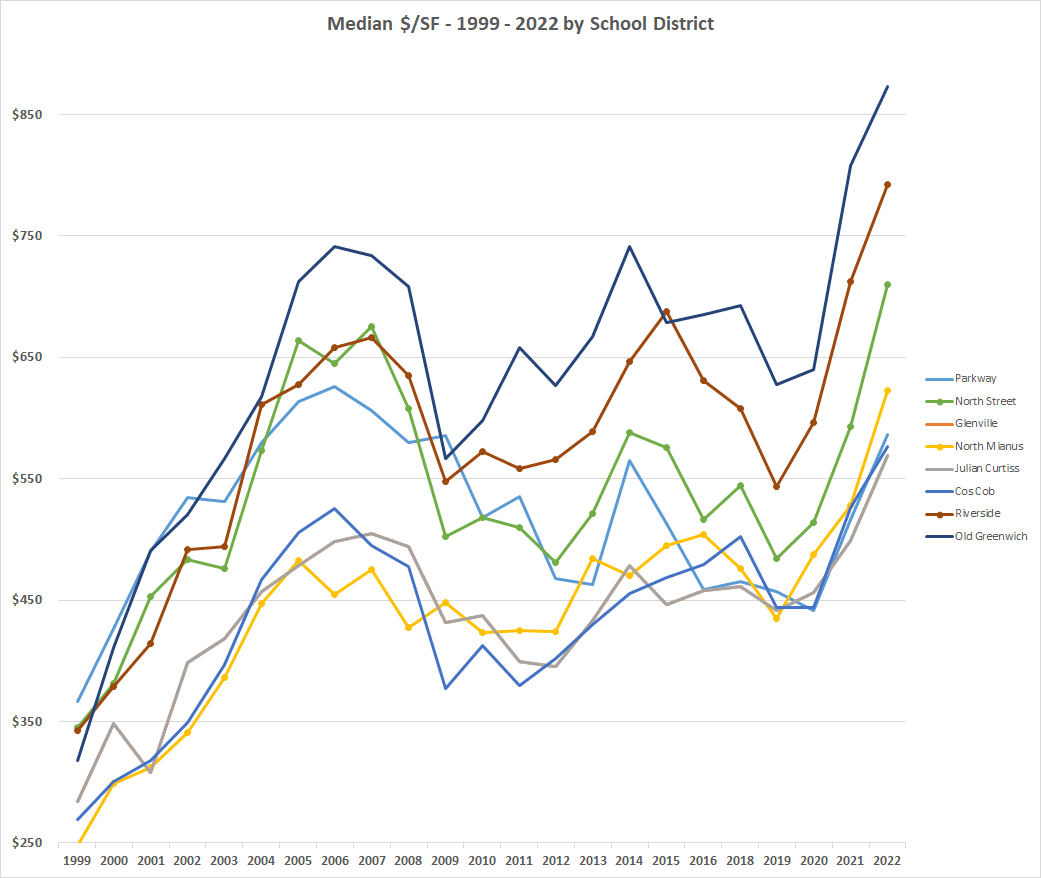
First, the good news, every area of town has seen the median price per square foot jump dramatically the last three years. For example, in the North Mianus school district, the median price per square foot went from $540/sf in 2021 to $644/sf in 2022, an increase of 19.2%. The North Street elementary school district did almost as well, going up 17.2% from 2021 to 2022. There the actual dollars went from $625/sf to $710/sf.
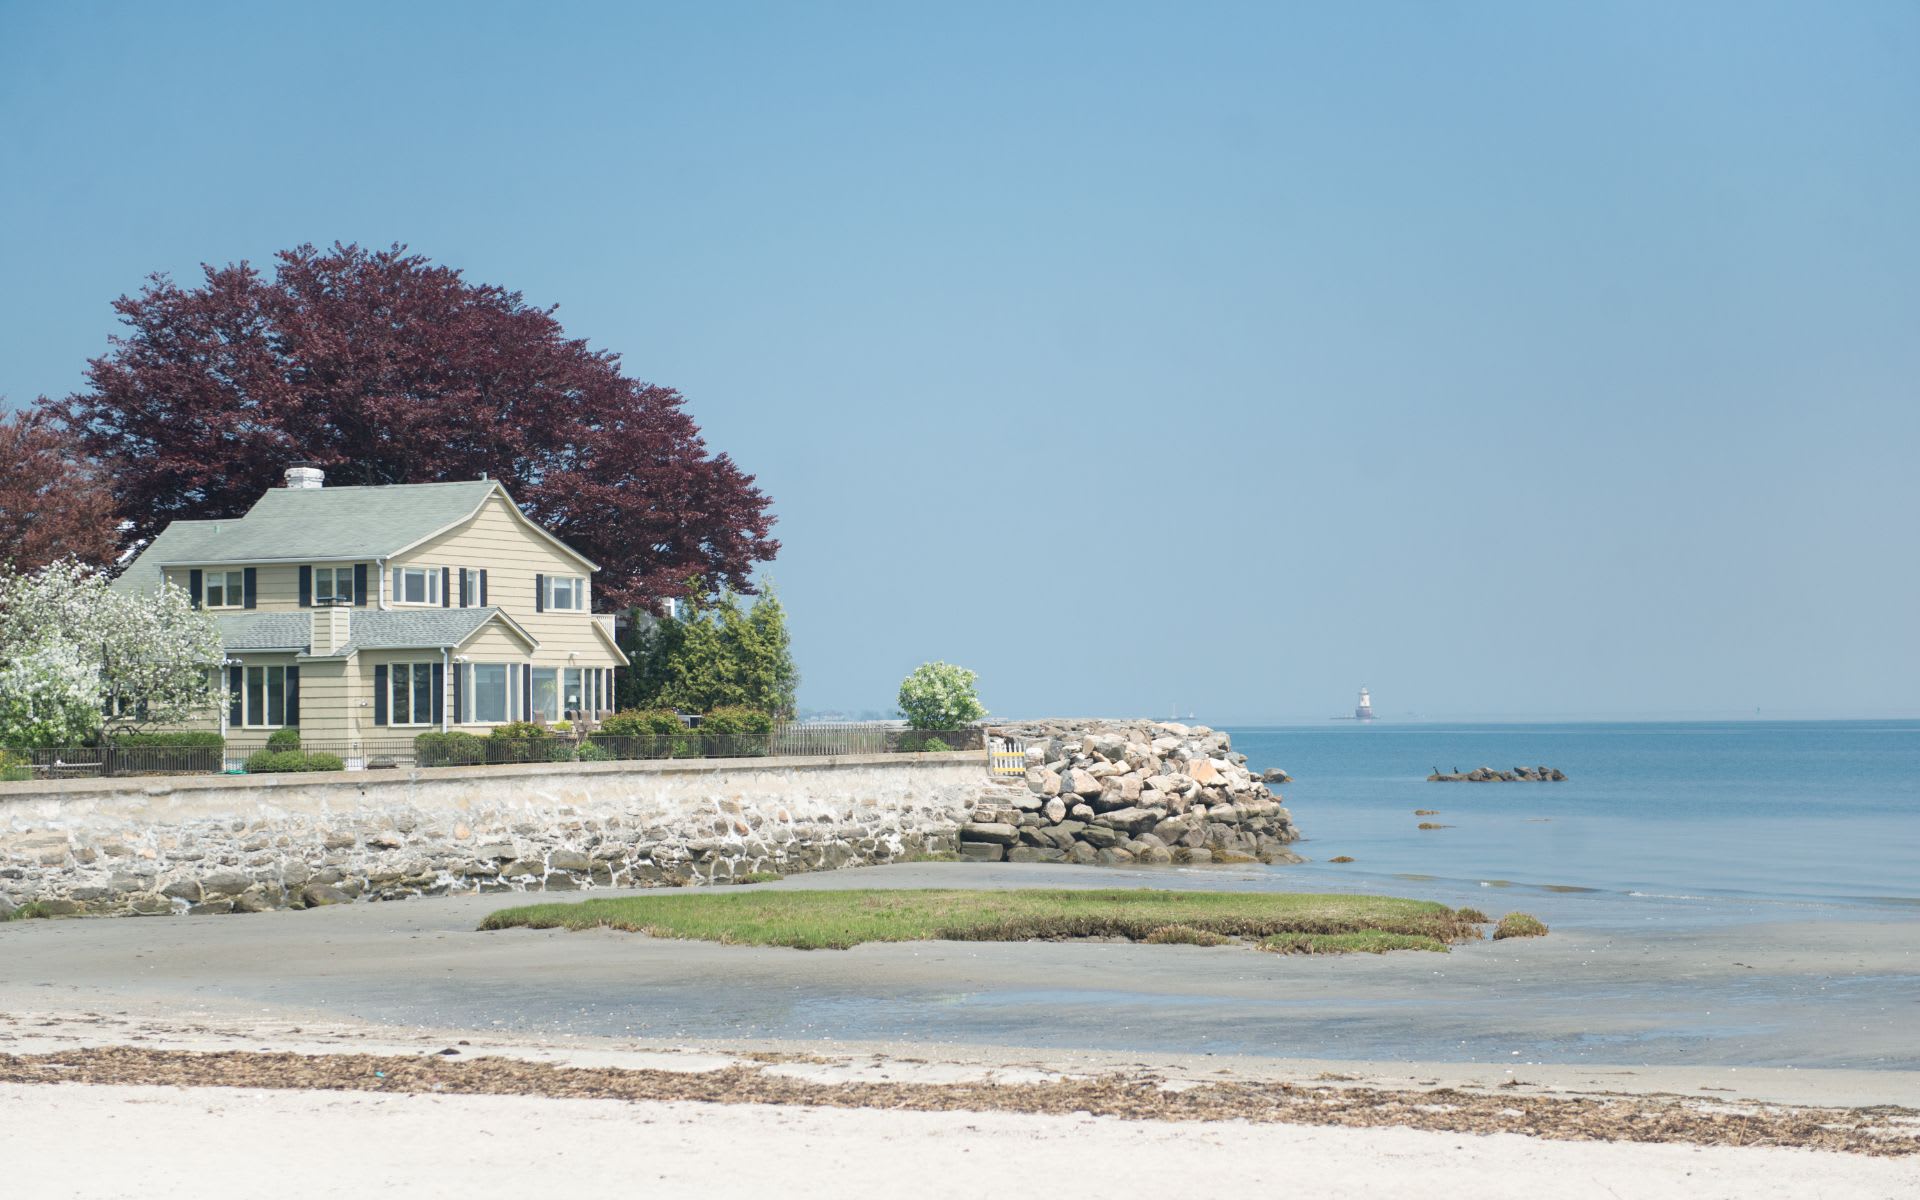
The school district that has held the record for highest price per square foot for 16 of the last 18 years is Old Greenwich, which finished the year at an all-time record for price per square foot of $873/sf. This was up 5.5% from 2021’s $808/sf. As you may noticed, Old Greenwich 2022 prices didn’t go up that much on a percentage basis. At the $873 per square foot, buyers are thinking twice about whether they might get more space for the same price in other areas of town. Then again, for all but 2009, when backcountry had a higher price per square, and 2015, when Riverside edged out OG, Old Greenwich has been the place where people are willing to pay more per square foot. That quaint little village, where I grew up, and two great town parks is quite a draw.
Every other school district has seen their price per square foot go up almost in steep straight lines. I can hear you asking, how can that be? We just had a major drop in sales. We went from 1,006 single family home sales in 2022 to “only” 637 sales in 2022. If demand is dropping shouldn’t our price drop per square foot drop? The short answer yes demand is down, but inventory is down even more. For all price ranges up to $10 million we have less than 5 months of supply.
That number is a little deceptive, as is is taking demand for single family homes for the whole year. if you take December’s sales, which were down 56% from December 2021’s very good sales, then our demand last month was under 5 months only for house that sold for under $3 million in December.
Price/sf versus median sales price
The number that most news reports focus on is the year to change in the average price, and if they are looking at Greenwich, it’s the year to change in the median price. The average price (add up all the sales and divide by the number of sales) jumps around a lot, because we have such a long tail of very high-end sales. If two highest sales from last year had also sold this year our average, the average sales price for 2022 would have gone from $3,050,000 to $3,192,488. This an increase of 4.7% and would have been due to 2 out of 639 sales. (A $50 million and a $45 million sale will do that to the average price, or around $3 million.)
As a result, lots of real estate people focus on the median price, the sales price where half of the sales prices are higher and half are lower. The median is a better indicator than the average price, but it still jumps around a lot as some year we have more high-end sales and some years we have more low-end sales. As a result, I prefer to look at the sales price/sf, since it is not as affected by whether more low-end or high-end sales are selling.
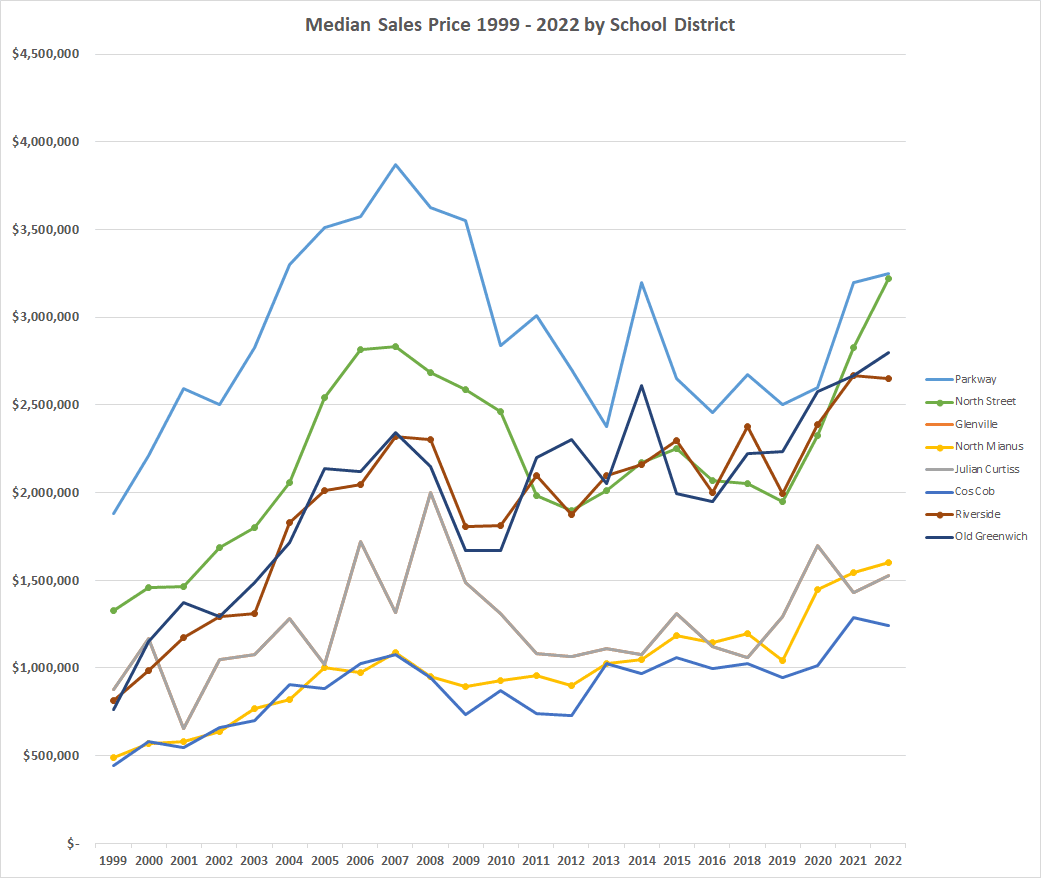
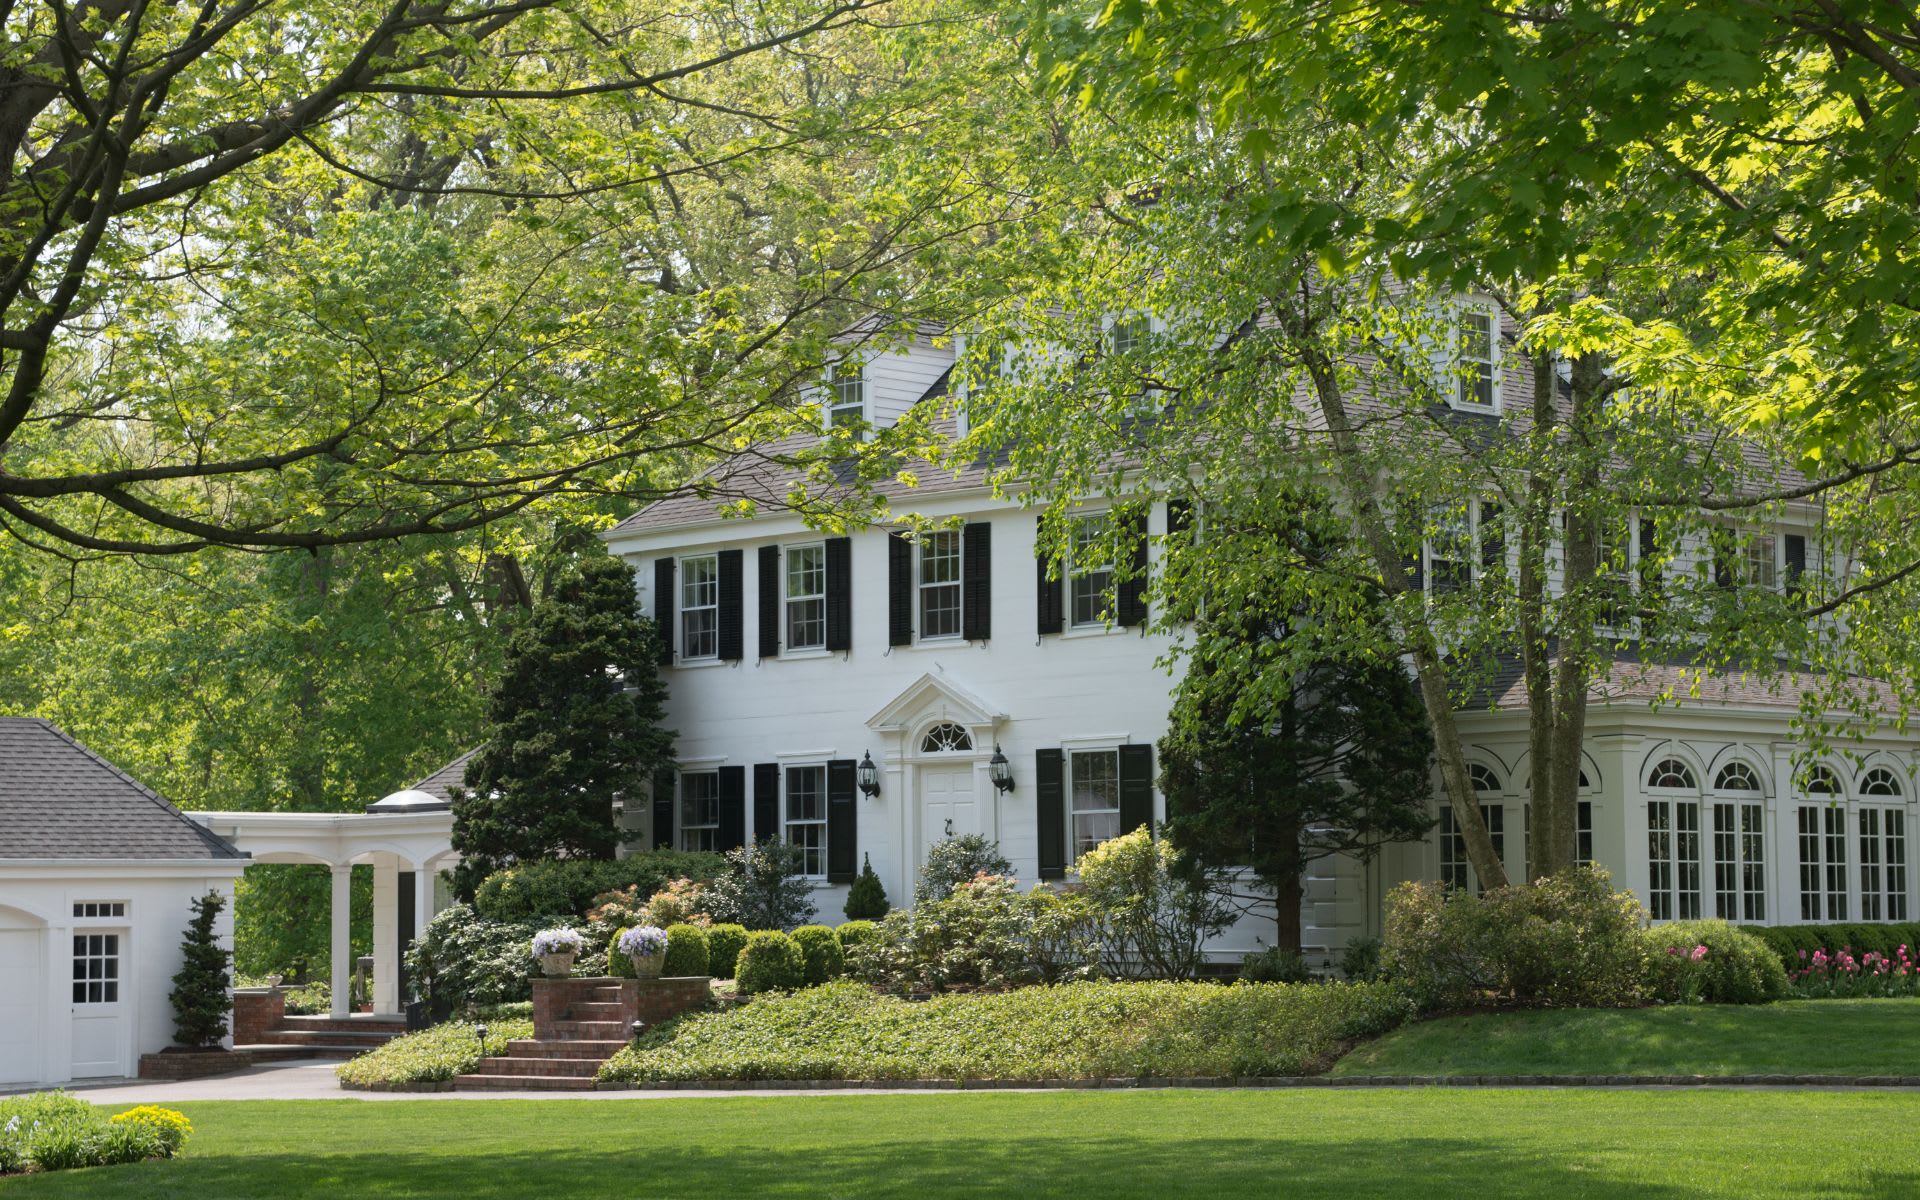
Having said that the median price is easier to understand, and it also allows for comparison to other towns, states and the whole U.S. where the average or median price is most used. When you look at the median price, the districts that stand out are Parkway and North Street. The Parkway school district covers all of backcountry and a large part of the two-acre zone just south of the Merritt Parkway. It has our largest properties by both acreage and by house square feet. In 2022, the median price in the Parkway school district was $3,250,000 up from $3,197,500 in 2021 or an increase of 1.6% The slower sales over $10 million mostly in backcountry were more than offset by the popularity of sales in the two-acre zone just south of the Merritt.
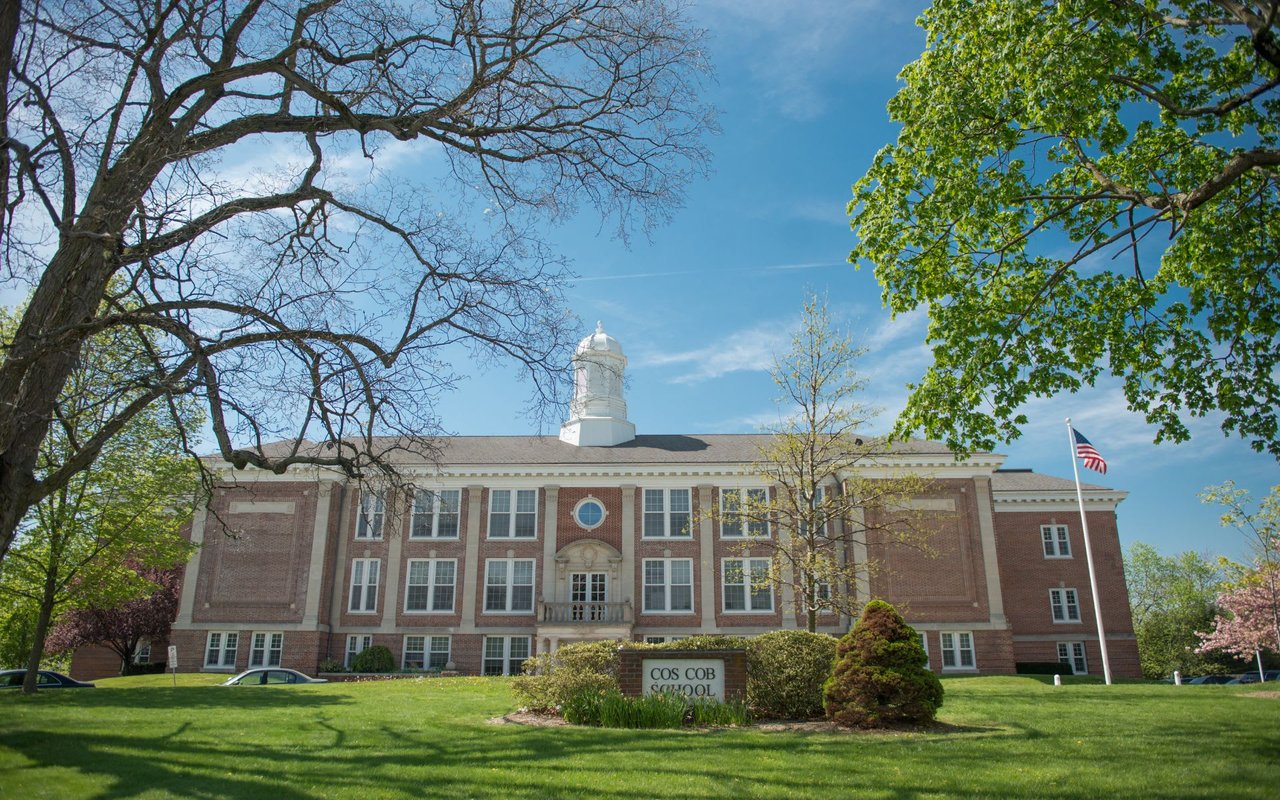
At the other end of the median price point, Cos Cob’s median price actually went down 3.5% from $1,285,250 in 2021 to $1,240,000 in 2022. We also saw the number of houses sold in Cos Cob drop from 66 sales in 2021 to 53 sales in 2022. However, if you look at the change in price per square foot, prices are up 9.7% in Cos Cob. Also, the 53 house sales in 2022 is still 4 sales above our 23-year average. Lastly, we got those 53 sales with very low inventory all year. Right now, there are only 9 house listed in Cos Cob. This low inventory and good demand led to days on market in Cos Cob dropping from 61 to 40 days.
Of course, Cos Cob is not our most affordable school district, that honor goes to the Hamilton Avenue and New Lebanon school districts. The problem is that the people who move into these two school districts tend to stay so we have only a limited number of sales (and we already have 8 lines on the charts which make them hard enough to follow as they are). Last year we only had 11 sales in the New Lebanon school district and only 2 houses sold in the Hamilton Avenue school district. We had a lot more sales in the Hamilton Avenue district, but they are mostly condominiums and duplexes, so they are not counted in single family home sales.
Total Sales Volume – What makes our Tax Collector smile, though not as much this year
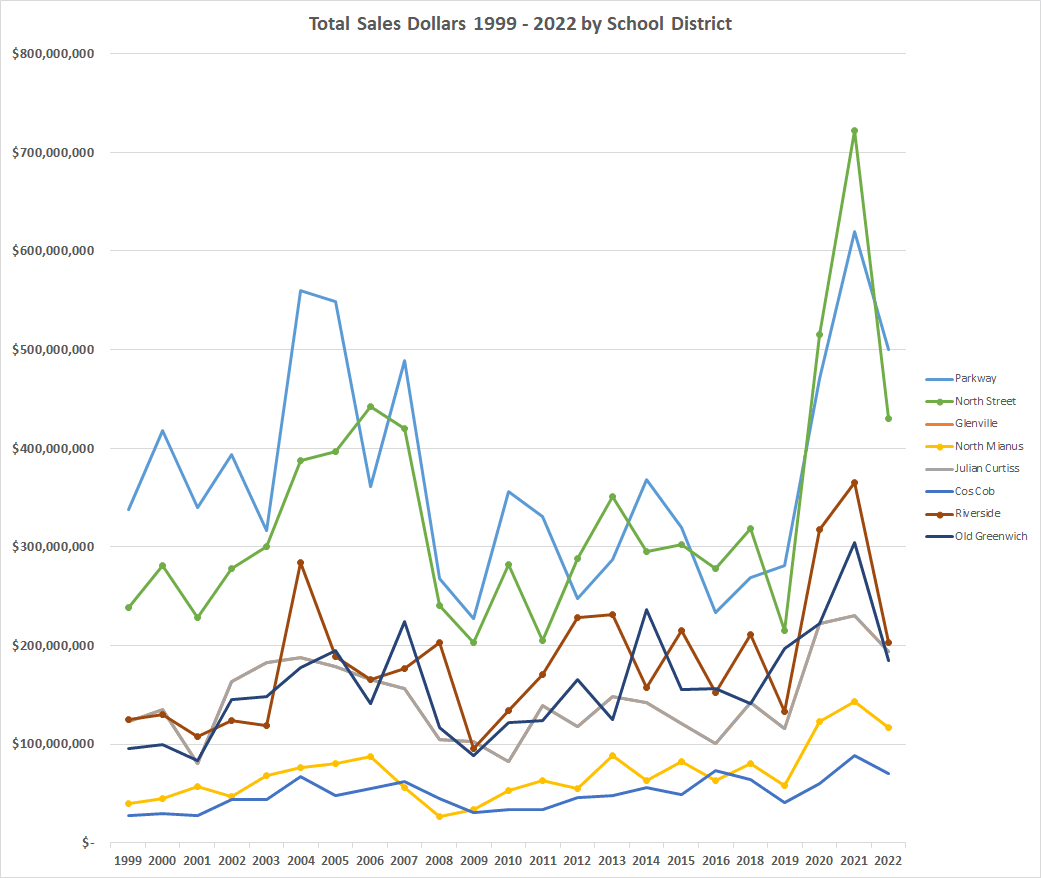
If you add up all the sales dollars in each of the school districts, two areas stand out. Parkway and North Street school districts again. Parkway had 129 sales last year at an average price of $3.88 million per sale for a total of a half billion dollars. North Street school district did pretty well too, as that district had 109 sales at an average price of $3.22 million. Median prices were up 14% and the price per square foot was up the aforementioned, 17.8%. However, in 2021 the North Street school district had 208 sales at an average price $2.83 million for a totals sales volume of $722.3 million.
Overall, sales volume in Greenwich was down $1.08 billion from 2021. This means a lot less conveyance taxes were paid to the Greenwich Tax Collector’s office. The drop in sales also means less new furniture and appliances purchased and fewer gut renovations.
Summary
Until November last year, we had a tight market, just about everywhere but backcountry, where the large number of slow selling listings over $10 million made for a looser market. For the rest of the town, and particularly for all areas where median prices are under $3 million, we have a tight market. The North Street and Glenville school districts did particularly well as this where we have most of our 1-acre and 2-acre zones. These continue to do very well even as fear of Covid is fading.
The year of 2023 is going to be very interesting in every part of town.
Stay up to date on the latest real estate trends.
Blog
What RealTrends Verified Actually Means for the Greenwich Streets Team
Blog
Blog
Blog
What the Numbers Actually Mean for You

Blog
What Every Greenwich and Stamford Pet Owner Should Know
Blog
What Actually Matters (And What Doesn't)
Market Report
Stamford, CT
We have 8 options for you
Blog
Discover the best places to live across Greenwich
We are a dedicated group of Greenwich natives. We have a deep passion for our hometown and enjoy everything the town offers its residents from the beach front to the backcountry. That is why we don’t find you just any home, we find you the right home.
MARK PRUNER
DENA ZARRA
RUSSELL PRUNER
COMPASS
200 Greenwich Ave
3rd Fl Greenwich, CT 06830