Greenwich 2023 Condo Prices Rise
Mark Pruner | October 19, 2023
Mark Pruner | October 19, 2023
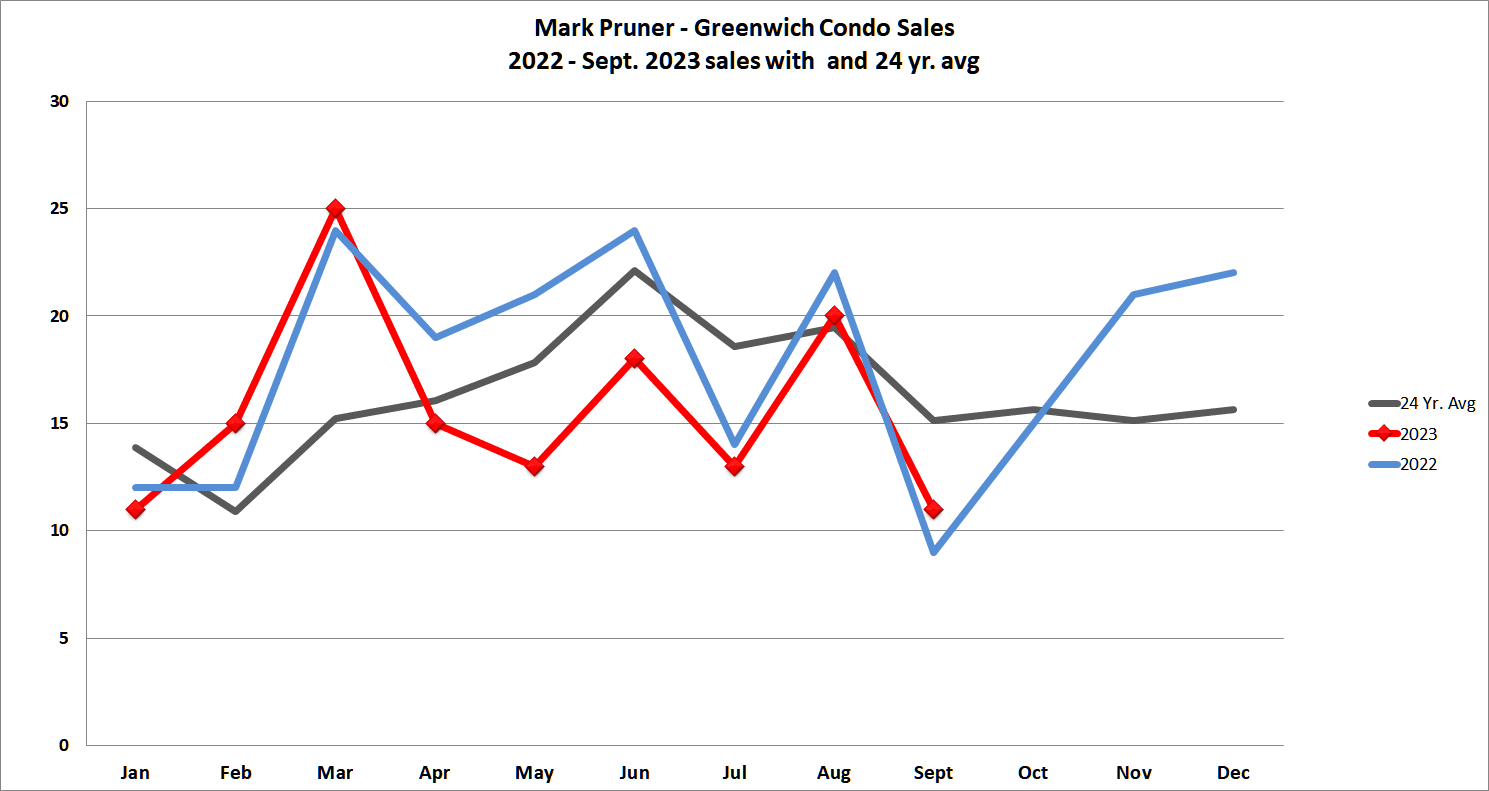
Condo sales in Greenwich stand out as distinct from other types of real estate transactions. Traditionally, house sales peak in June or July, and this monthly sales pattern remains consistent from year to year. Rentals, on the other hand, peak from May to July and exhibit a reasonably steady monthly sales pattern. Condominium sales deviate from the norm. This year, condo sales reached their peak in March, mirroring the same trend from the previous year. In prior years condo sales have peaked in September and even December.
This erratic monthly sales pattern can be attributed in part to the law of small numbers. Compared to house sales and rentals, Greenwich has many fewer condo sales. Over the past 24 years, the average annual condo sales in Greenwich have been 196, with annual sales fluctuating between a low of 91 sales in 2009 during the recession and a high of 265 sales in the booming year of 2021. Condo sales don't just jump aroud in boom and bust years. In 2011, there were only 112 sales, and in 2005, there were 262. To establish a smoother monthly sales curve, one must consider a 24-year average. The small number of sales each month leads to significant month-to-month fluctuations.
BTW: All numbers in this article include co-op sales as part of the condo totals. Our 141 "condo" sales includes 18 co-op sales so far this year.)
You might be wondering why this lack of seasonality in condo sales matters. It's important if you are a condo owner contemplating selling or if you are in the market to purchase one. In reality, every month can be a good or bad month for condo sales, and this uncertainty means you can't predict the ideal month to either buy or sell.
We have a spring market, because that when the largest number of homeowners decide to sell their house. Picking one season when there's plenty of inventory doesn't apply to the seasonality-less Greenwich condo market. At the start of 2023, there were 41 condo listings, which reduced to 38 in May and remained the same 38 condo listing in September.
Since seasonaility isn't a good guide for buyers what is? If you're a buyer looking for a bargain, pay close attention to the days on the market for each specific condo. Listings with significantly above-average months of supply are typically overpriced, have some significant issues (like being located near a highway), or require extensive renovations. Reducing the price can address all three issues, even if it results in a lower price per square foot compared to the competition. It's suprising how often a seller with high DOM, will accept a reasonable offer, just don't start out with low-ball bid or you are likely not to get a counter.
Over the past three years, the condo market in Greenwich has experienced a surge in sales. Sales have increased from 159 in 2019 to an all-time high of 265 in 2021. Up to September of this year, there have been 141 sales, which, when annualized, would be 188 sales for the year, slightly below the 196-average condo sales over the last 24 years. Given our low inventory, that's still a pretty impressive number.
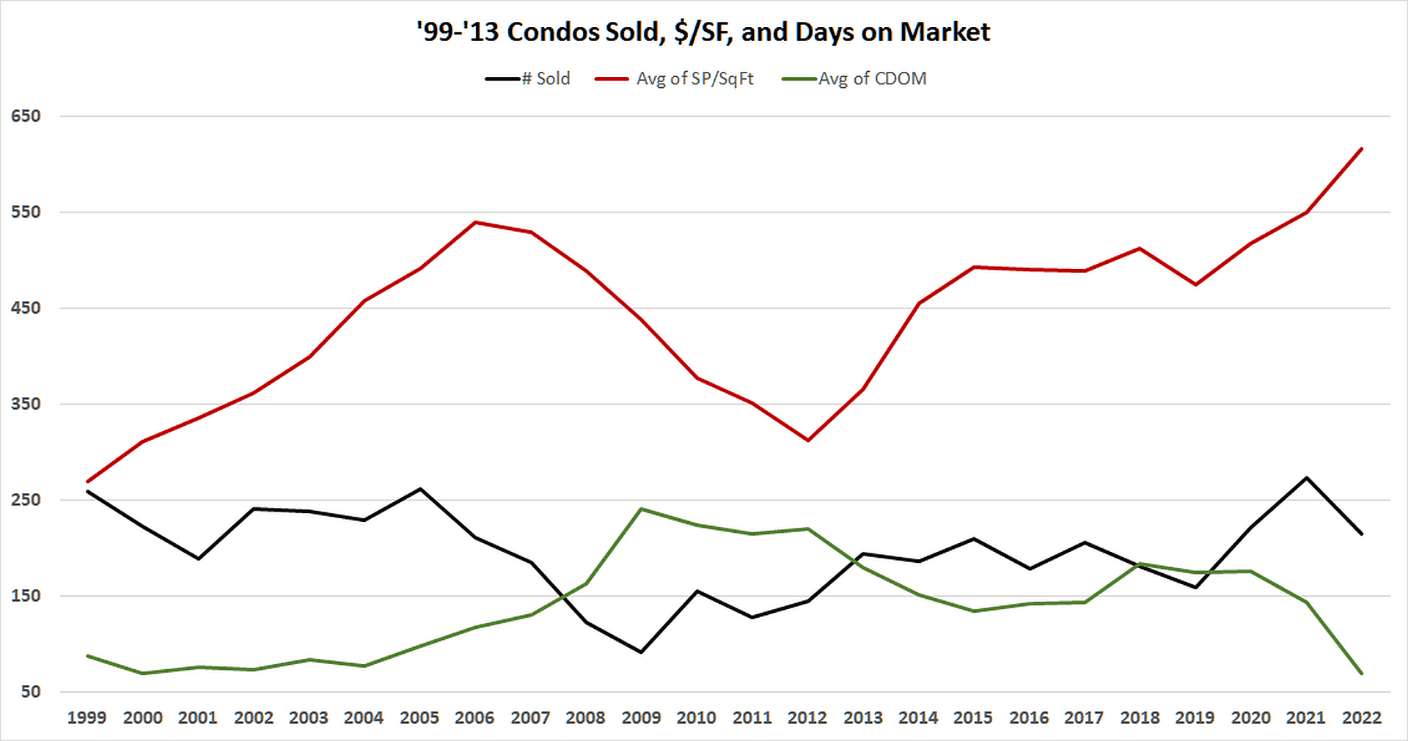
While slightly below average condo sales for 2023 may not sound exceptional, other market indicators are more promising. The price per square foot increased from $475/sf in 2019 to $616/sf in 2022, a 29.7% increase in three years. This year, the price per square foot is even higher at $692/sf, a 12% increase from the previous year.
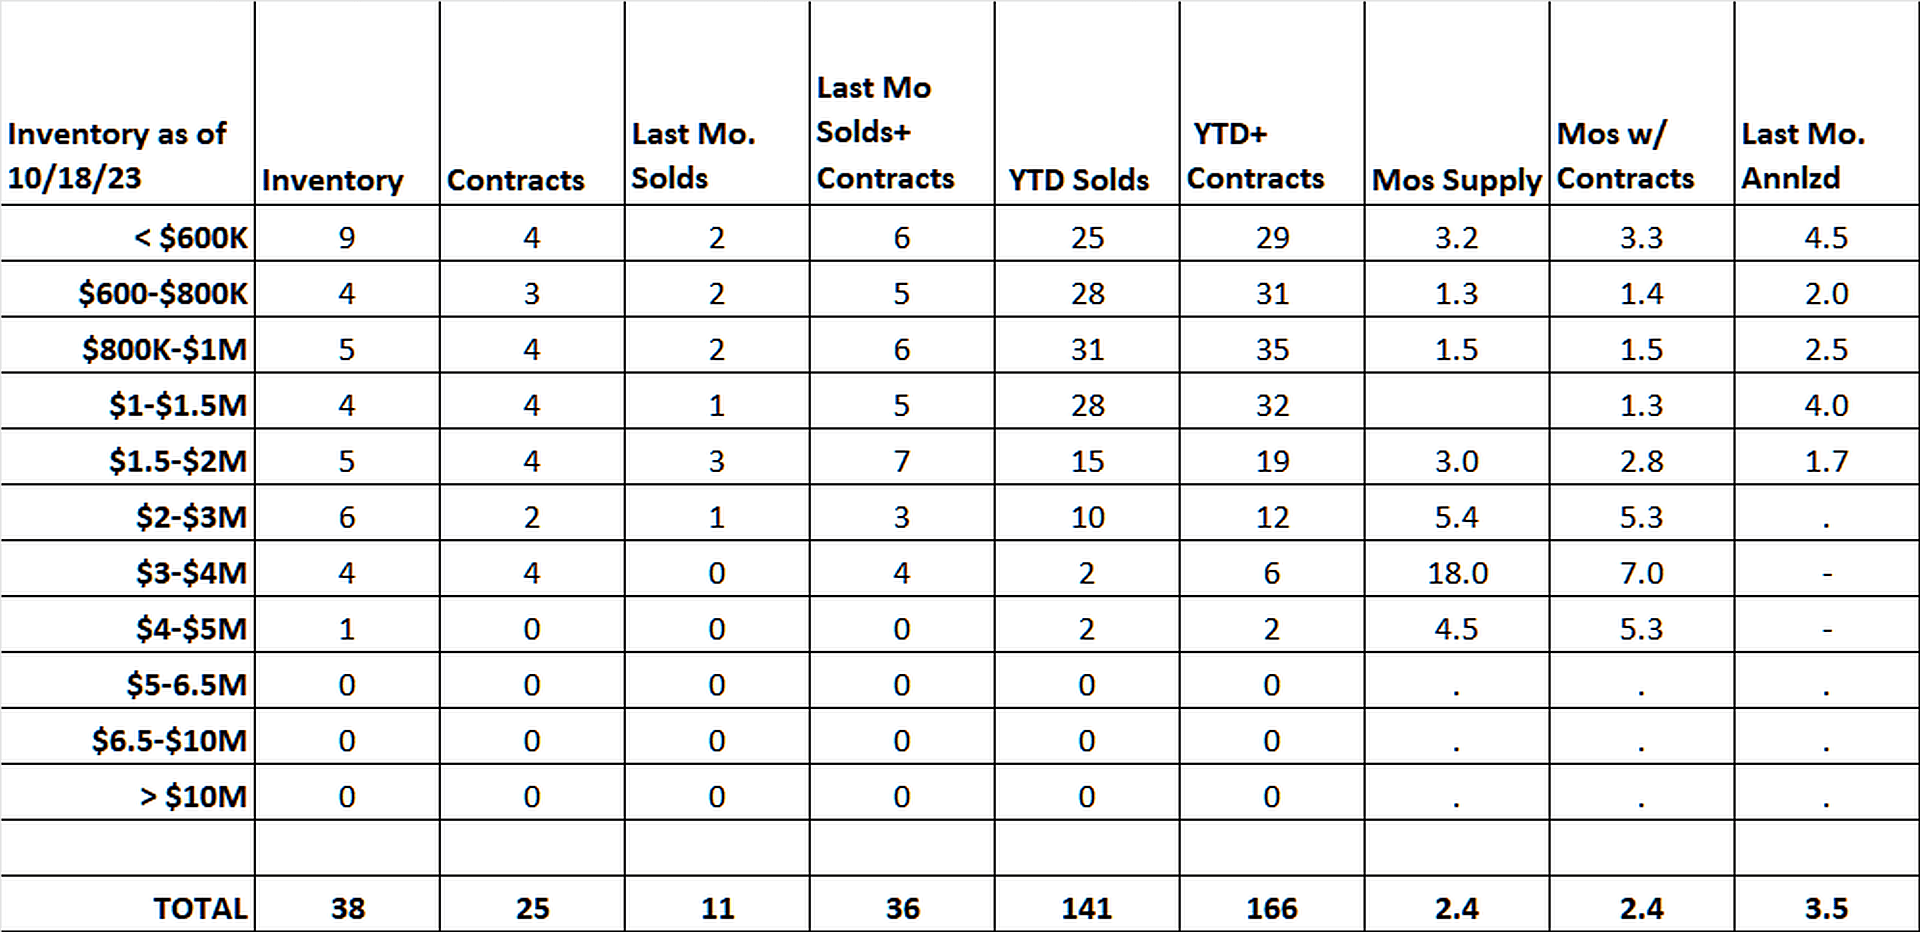
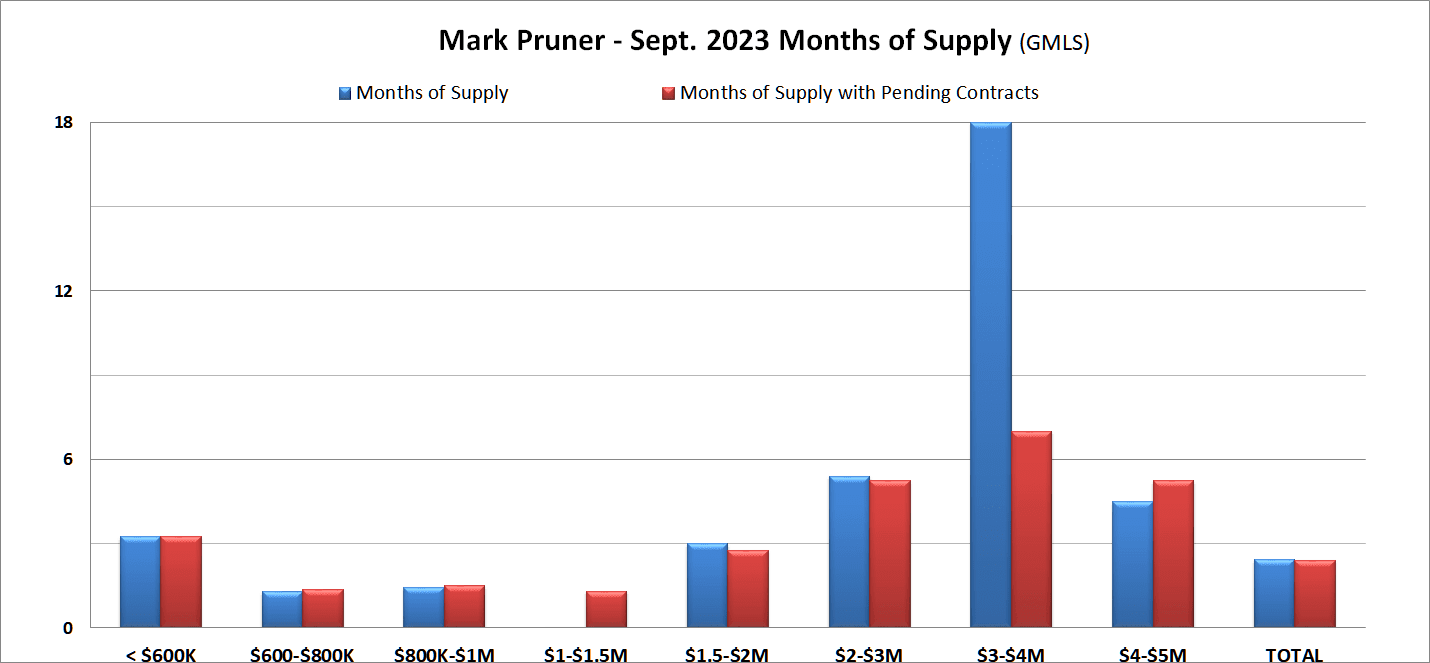
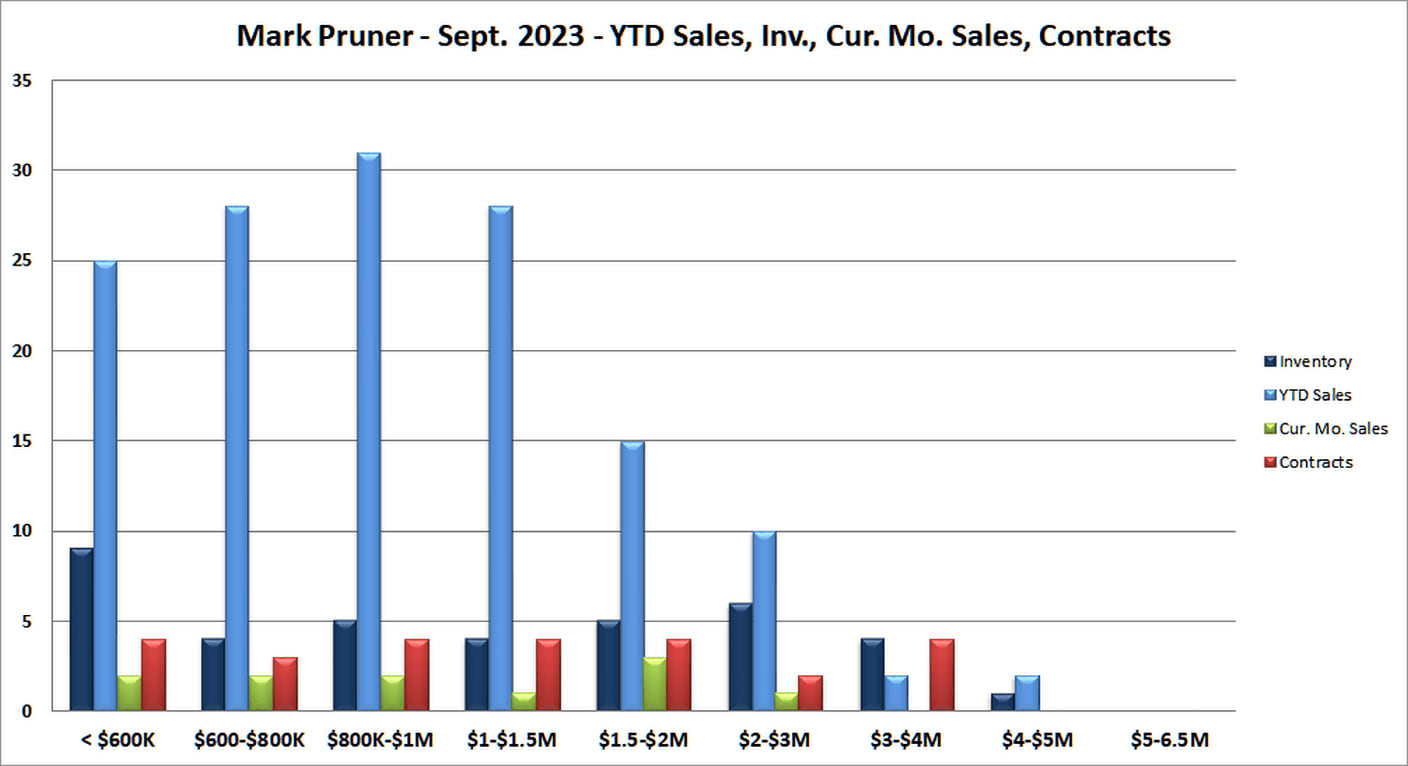
Right now all price categories are under 6 months of supply, so it’s a good time to list. Except if you have one of the rare high-end condos in the $3-4 million price range, where we have 18 months of supply. However, if you add in the 4 contracts waiting to close, the months of supply drops to 7 months of supply. Also, do a little sensitivity analysis. We only have 4 listings, between $3 and 4 million. Take away two of this and all of sudden our months of supply drops by half to 9 months of supply. The best thing to do is to look at those four listings and see how your unit compares.
If you are buyer looking for a bargain, you want to pay more attention to days on market for each particular condo. Any listing with well above average months of supply, means that it’s over-priced and the seller doesn’t want to lower the price to market price, there’s something wrong with the unit (it’s next to the highway) or it needs a lot of work. A lower price cures both of the second and third problem even if that means the price/sf is much lower than it “competition” (which aren’t a highway and don’t need major renovations.)
Overall, the last three years have lit a fire under the condo market. Sales are up from 159 sales in 2019 to 215 sales last year. Condo sales set an all-time high in 2021 with 265 sales. So far through September, we have had 141 sales, which if you annualized that number would be 188 sales for the year, which is a little under our 196 average number of condo sales over the last 24 years.
Average sales for 2023 don’t sound that spectacular, until you look at the other numbers for the market. Our price per square foot went from $475/sf in 2019 to $616/sf in 2022 or an increase of 29.7% in three years. So far this year, the price per square foot is even higher at $692/sf or a further increase of 12% over last year.
Our sales started to pick up in 2020 and even more so in 2021, particularly in the second half of that year. In 2021 condos sales set our all-time high of 265 Greenwich condo sales in one year, however that record was not that much above the previous record of 262 sales in 2005.
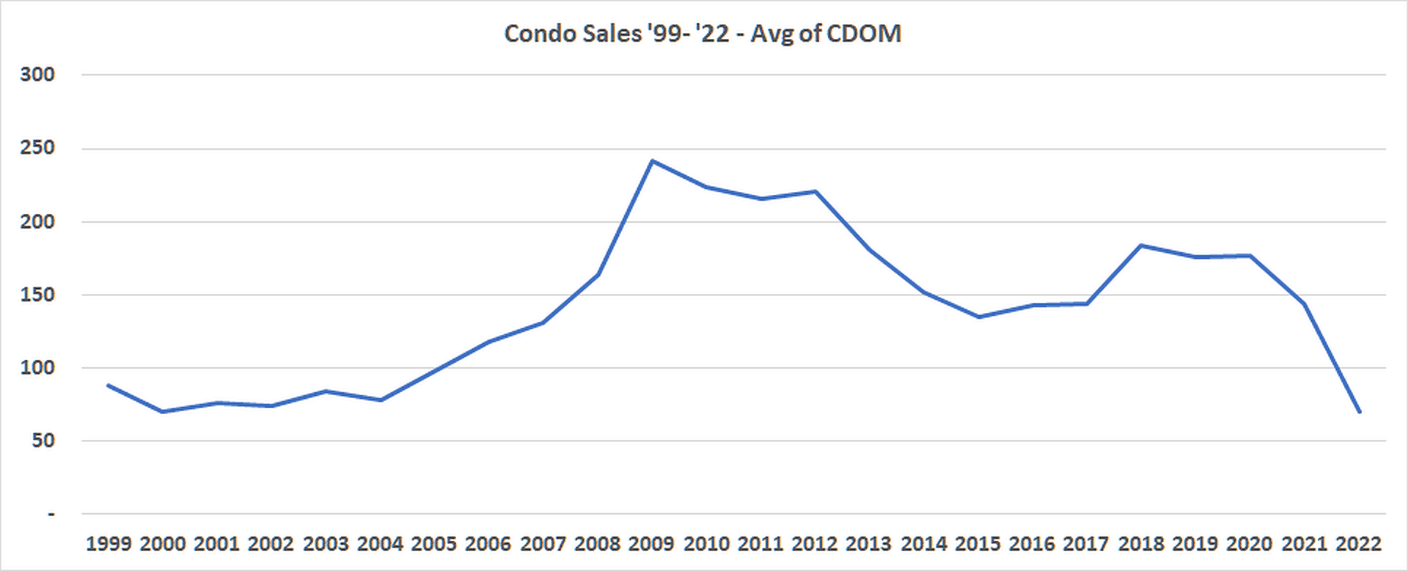
Days on market has also dropped a lot from 2019 to this year. In 2019, our last pre-Covid year, condos sat on the market for almost half a year before selling after an average of 176 days on market. The days on market number was essentially unchanged in 2020, as some long-term listings sold keeping the average DOM at a high level. Townhouses and garden style condos, like Lyons Farm, did well in the first part of Covid as people really wanted space and social distancing. By 2022, we had sold off many of our long-term listings. As a result, days on market dropped from 176 days on market in 2021 to 144 days DOM in 2022.
Back in 2018, we had 139 condos on the market and our DOM was 184. This compares to May of this year, when we only had 38 condo listings on the market and sold condos were only on the market for an average of 66 days on the market, our lowest ever. Since May, we have dropped down to only 61 days on the market.
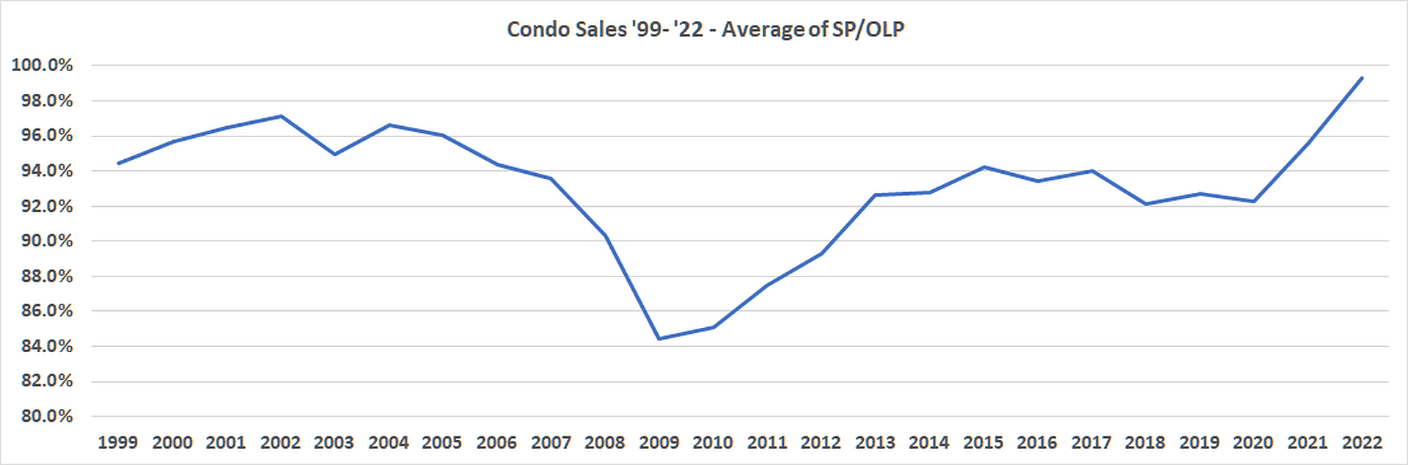
Our sales price to original list price ratio has also taken off in that same period. For the years from 2013 to 2020, our average sales price to original list price was right around 93%. Then in 2021 it ticked up to 95.6% and went almost to full list price in 2022 at 99.3%. This year has dropped back a smidgen to 98.4%, but don’t let that drop fool you. That is still the second highest SP/OLP ratio that we have ever had.
In 2018, we had 36 condos listed over $2 million dollars and right now we only have 11 condos, and that’s even with the significant appreciation we have had in the last five years pushing more condos over $2 million.
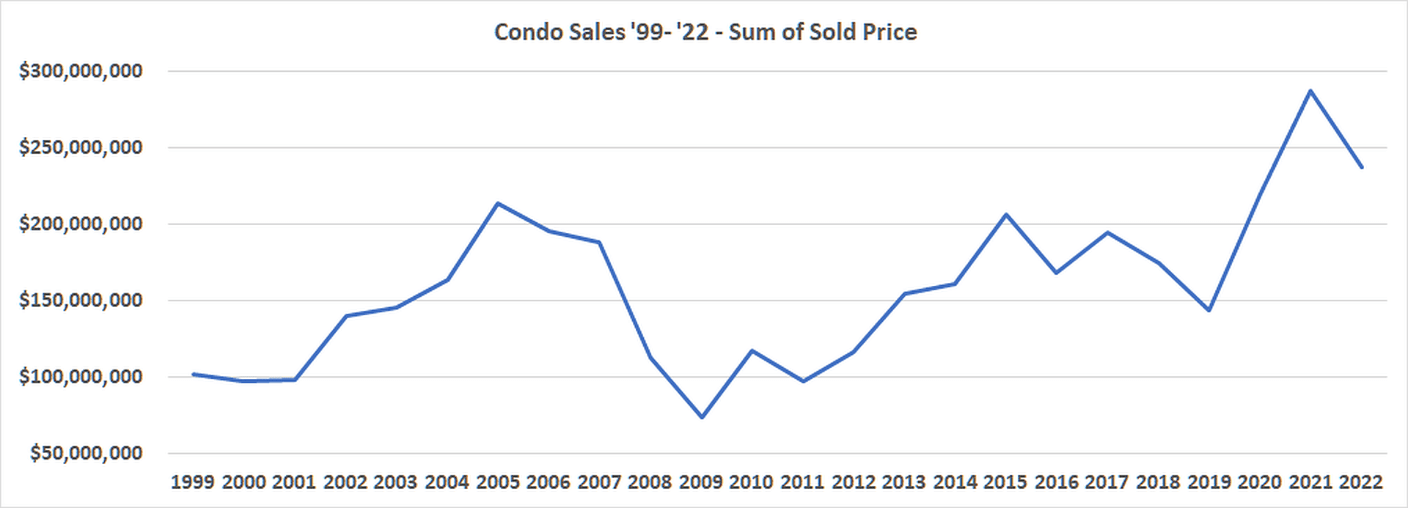
Our present increase in sales, though less so at the high-end, pushed total condo and co-op sales volume to $288 million dollars in 2021. In 2022, we dropped back to $237 million, which is still the second highest on record at a time when sales were constrained by low inventory. So far this year, we have had. $163 million of condos sales, which annualized would come out to be $217 million. If trends continue, this year will be the third highest total condos sales volume.
Condos provide a great place for people that really want to live in Greenwich at more reasonable prices.
Stay up to date on the latest real estate trends.

Blog

Blog
Blog
What the Numbers Actually Mean for You

Blog
What Every Greenwich and Stamford Pet Owner Should Know
Blog
What Actually Matters (And What Doesn't)
Market Report

Stamford, CT
We have 8 options for you

Blog

Blog
Discover the best places to live across Greenwich
We are a dedicated group of Greenwich natives. We have a deep passion for our hometown and enjoy everything the town offers its residents from the beach front to the backcountry. That is why we don’t find you just any home, we find you the right home.
MARK PRUNER
DENA ZARRA
RUSSELL PRUNER
COMPASS
200 Greenwich Ave
3rd Fl Greenwich, CT 06830