Greenwich 3rd Quarter Real Estate Market Report - 10/03/22
Mark Pruner | September 3, 2022

Mark Pruner | September 3, 2022
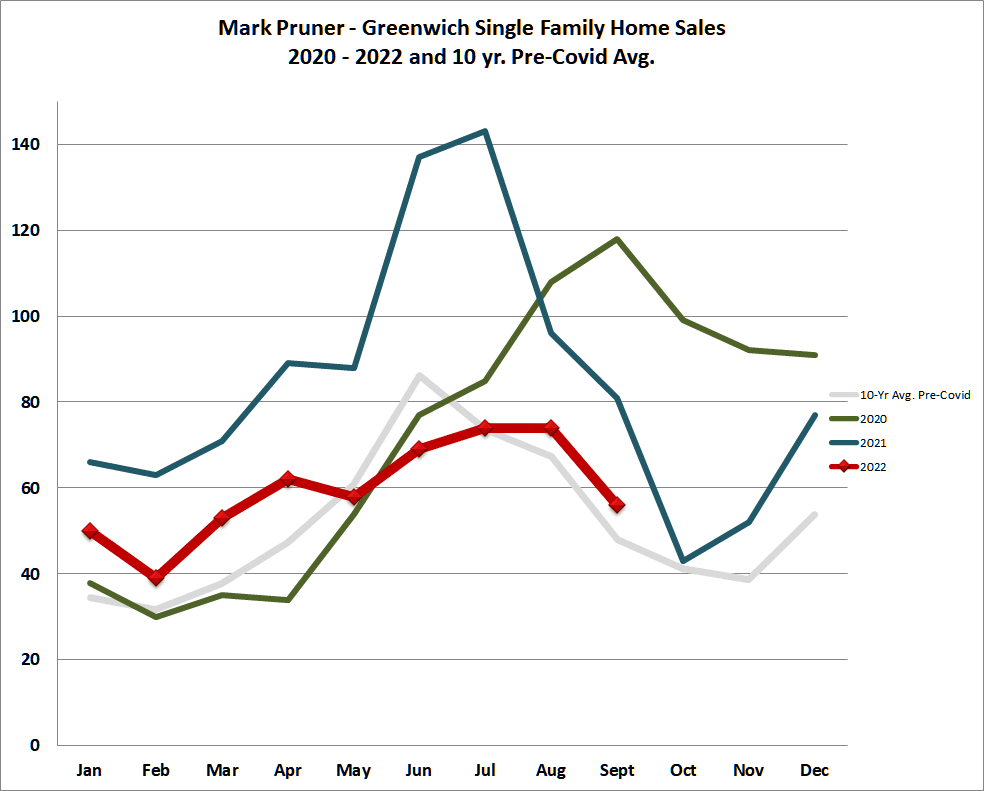
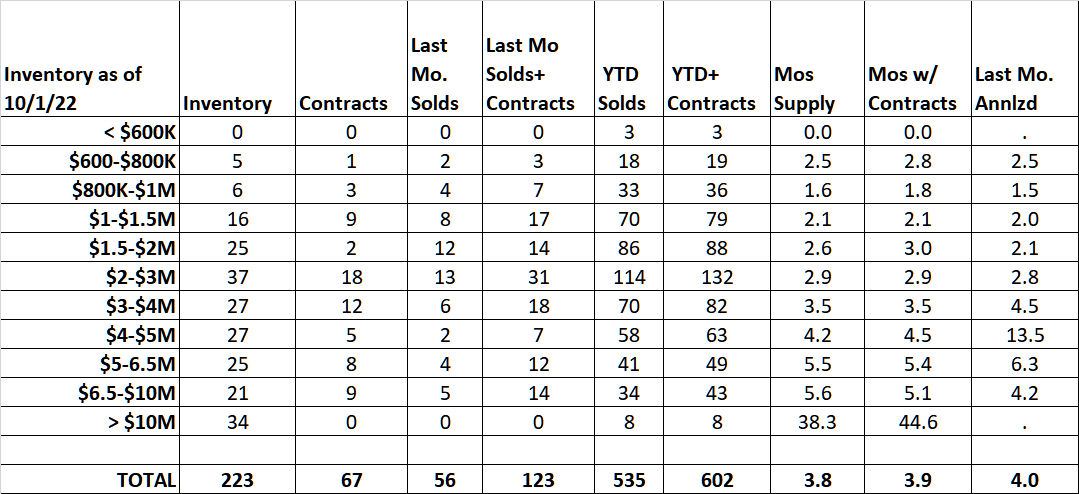
We had 56 single family sales in September 2022; this compares to our 10-year pre-Covid average of 48 sales. The really remarkable thing is that we only had an average of 213 listings for the month. Now we had 74 new listings come on the market, which meant that we started the month with 198 listings and after new listings and contracts, we ended up with 223 listings. This “dramatic” listing increase of 12.6% in one month was in reality only 25 listings; a number that we would often add in a week in a normal fall market.
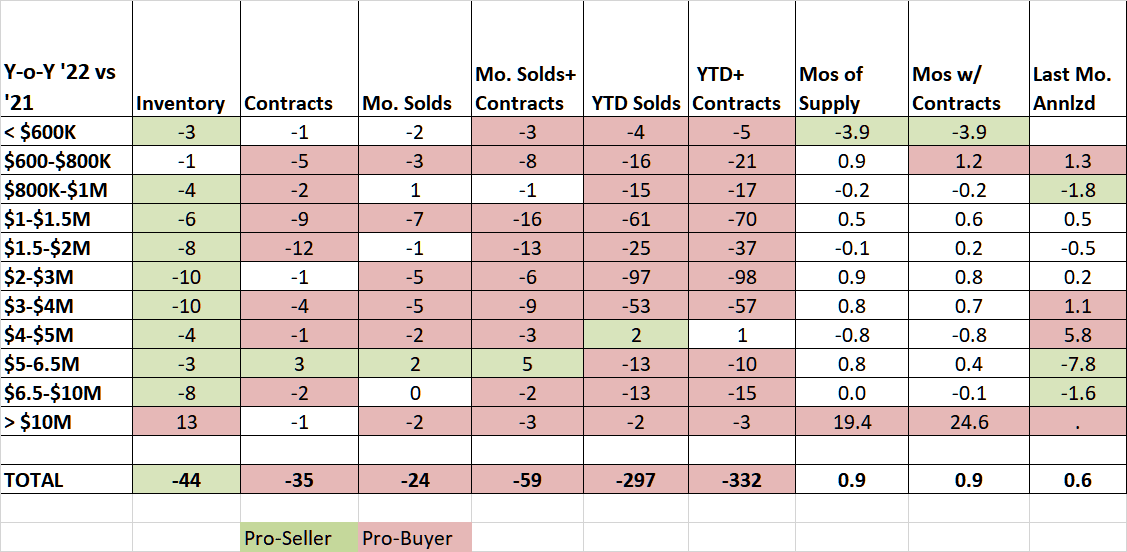
Our September sales were up 17% over our 10-year average while our inventory stayed at very low levels. This analysis however is not what you are seeing in most analyses in the national press, which focuses on year over year sales comparisons. In normal markets, year over year comparisons are useful, but they have very limited applicability in 2022 when 2021 was an all-time record. Last September we sold 81 houses so year over year our sales dropped 31%. A 31% Many markets around the U.S. saw similar drops in sales which make for dramatic headlines. The problem is that the headline says our sales levels are bad, when they aren’t, at least in Greenwich, where September sales were up 17% over our 10-year pre-Covid average.
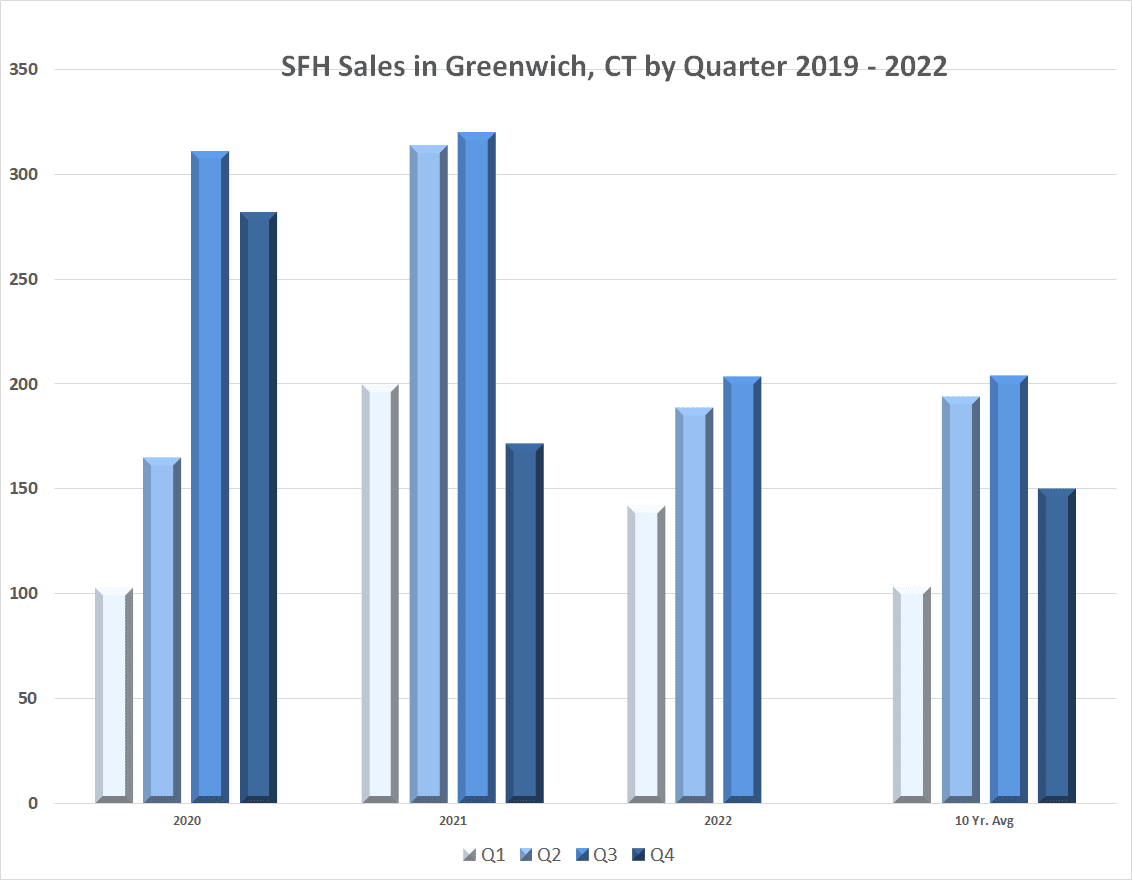
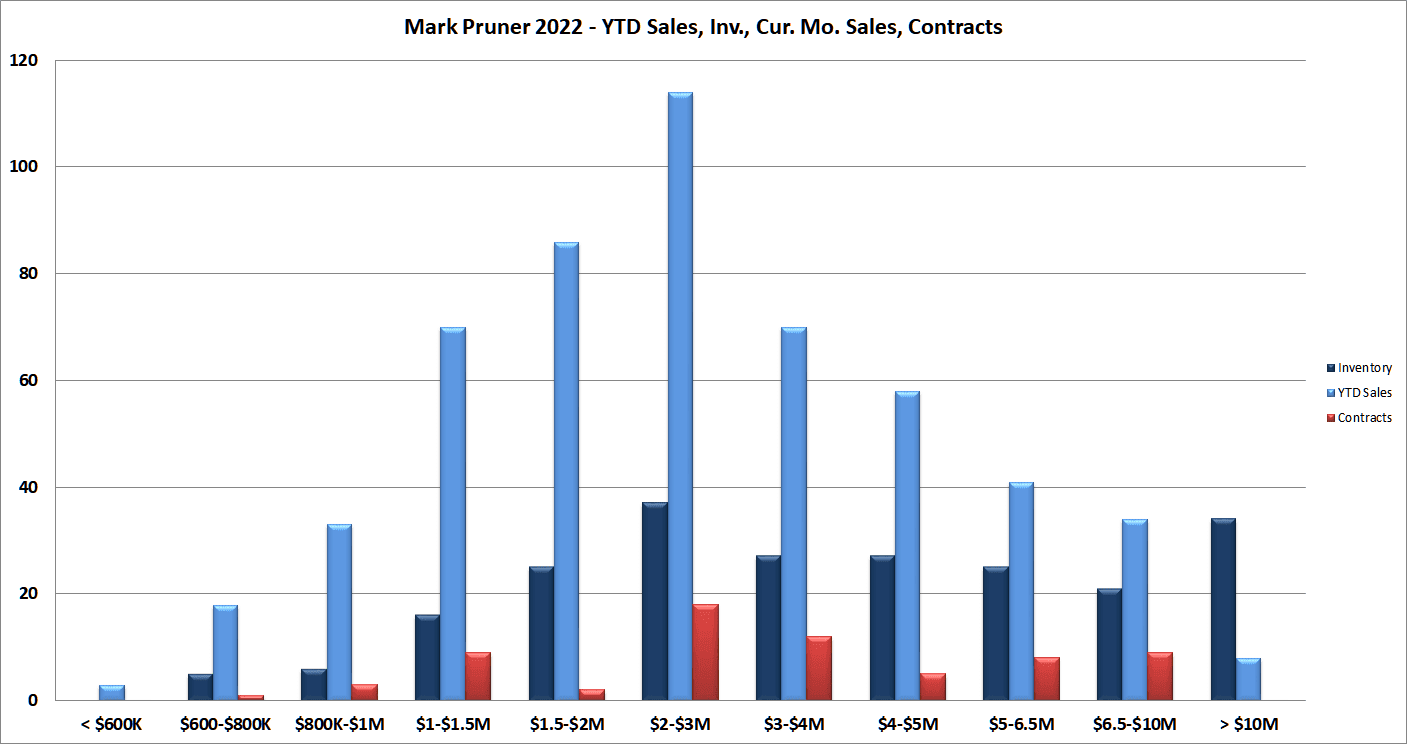
If you expand from last month to the entire third quarter, you see similar year over year numbers. We had 204 sales in the 3rd quarter. This compares to our 10-year pre-Covid average of 189 sales meaning our third quarter sales were up 8.5% over our 10-year average. At the same time our 3rd quarter sales were down 36% from last year’s all-time record 3rd quarter of 320 home sales.
Clearly, our 3rd quarter and September sales didn’t come near last year’s sales, but we did it with much less inventory. If you go back to our last pre-Covid year, we had 629 houses for sale in September 2019. While our sales may be down 36% from last year, our inventory is down 65% from 2019 and down 17% from September 2021.
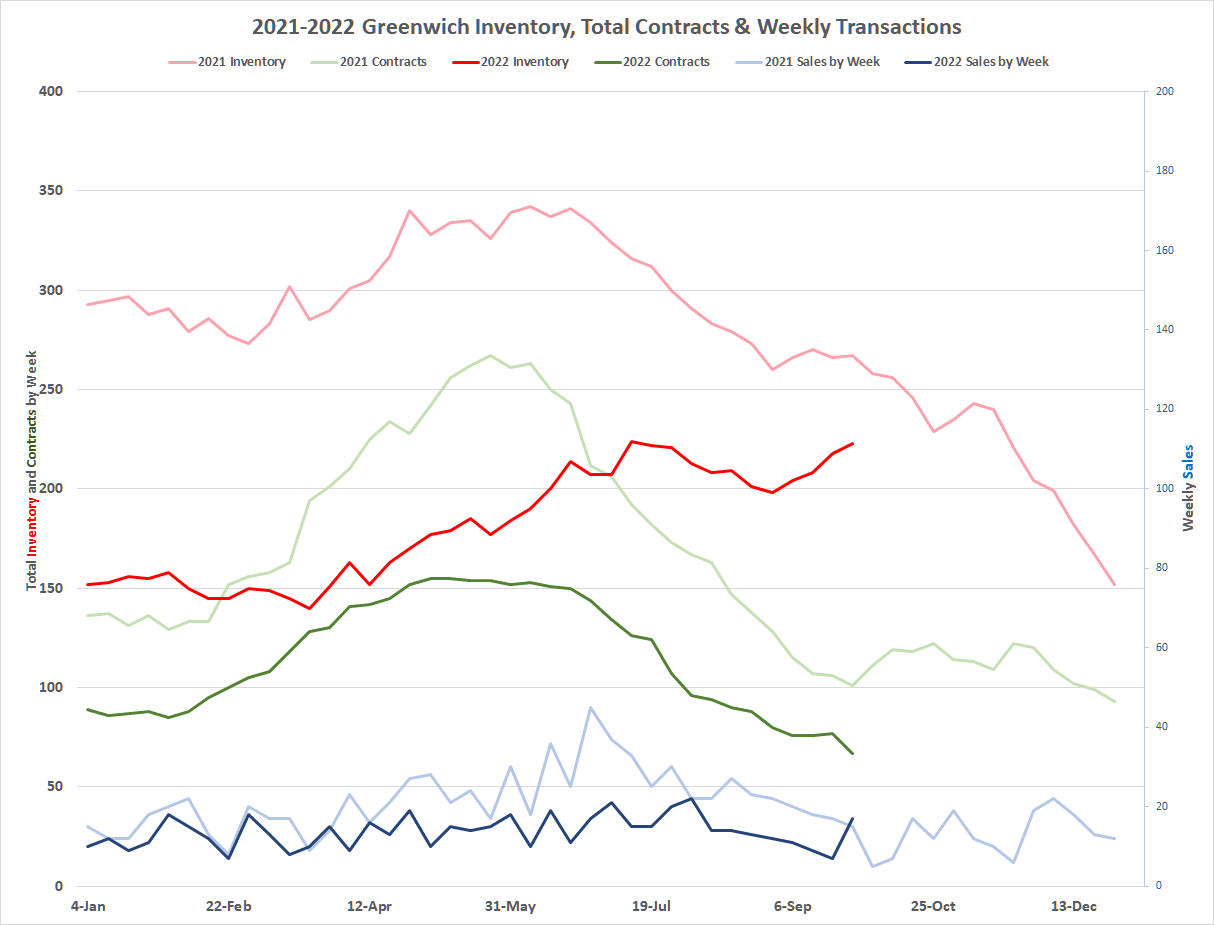
If our sales are above average, does that mean despite all the national press coverage, that we really have a good market. The short answer is that we do, it just doesn’t compare well to an all-time record year. The question is for how much longer? At the end of September 2022, we had 67 contracts compared to 101 contracts at the end of September 2021. This is even below the 69 contracts that we had at the end of September 2019.
Clearly, the market is weakening, but it does that every year at this time. Our contracts usually peak in May, leading to sales peaking in June or July as these contracts close. This year we are seeing contracts drop at a faster rate. This drop however is only slightly influenced by higher mortgage interest rates. You can see this by our tiny 35 median days on market and the sales of the of most interest sensitive houses, those under $1.5 million.
In September 2022, we sold 14 houses under $1.5 million, where typically mortgages are used. In September 2019, we sold 20 houses under $1.5 million. This 30% drop is partially due to higher interest rates, but the main reason for the drop is the lower inventory in 2022. In September 2022 we only had 27 listings under $1.5 million compared to 115 listing priced under $1.5 million in September 2019. This 77% drop in inventory is limiting sales. As a result, the median days on market has gone from 143 days in 2019 to only 35 days now. If we had more inventory, we would have more sales.
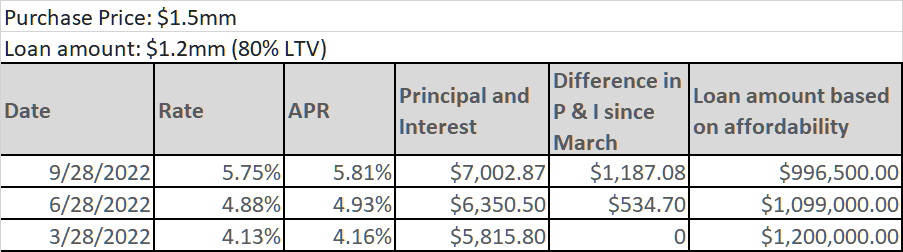
This is not to say that higher interest rates aren’t have an impact on the market. Jay Castro of JP Morgan Chase in Riverside sent me an interesting table he had prepared. If you are purchasing a $1.5 million house and taking out a typical 80% mortgage, you monthly payment has gone from $5,816 in March to $7,003 in September, or a jump of $1,187 in your monthly payment. Additionally, some of those payments are going to be made with after-tax dollars as the limit on interest deduction is only for the first $750,000 of principal.
Purchase Price: 1.5mm
Loan amount: 1.2mm (80% LTV)
To my mind even more dramatic than the change in the monthly payment is the change in what you could afford. At the end of March, you could afford a $1,500,000 house with a $5,816 monthly payment. By the end of September that same payment would only get you a $996,500 loan and at 80% you could only afford a $1,246,000 house. This is a drop of $254,000 in purchasing value. To make it even more difficult, house prices were continuing to go up from March to September.
Another effect of this drop in affordability from $1.5 million to $1.25 is that you have fewer houses to pick from In Greenwich we only have 18 houses under $1.25 million. If you could afford a $1.5 million house, you could pick from 29 houses.
The buyer who needs a mortgage has a difficult choice, either buy the $1.5 million house and pay $1,200 more in their monthly mortgage payment or have fewer choices and buy a 400 s.f. smaller house. (This last is based on our YTD average $/sf of $644 for sold properties around $1.5M.)
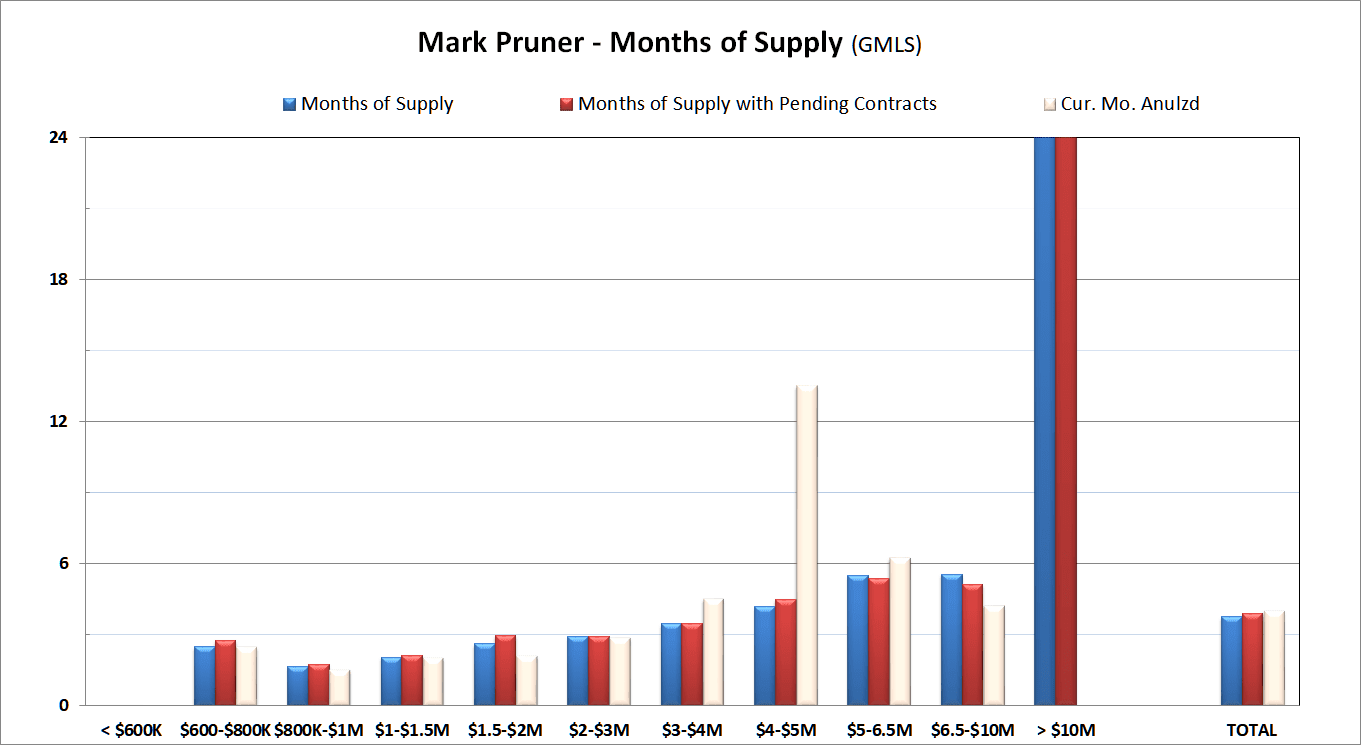
What buyers under $1.5 million are confronting is a very competitive market with less than 2 months of supply. They also be prepared to pay all cash, or at least waive their mortgage contingency, if they want to compete in this high demand/low inventory price range.
While sales overall are down from last year, one price range actually has more sales this year than last year. From $4 – 5 million, we have 58 sales this year which is up 2 sales from last year’s record. We have seen a slight decrease in contracts in that price range compared to last year, but we are still down from 5.0 months of supply last year to an even more pro-seller 4.2 months of supply.
In September this year, we are also seeing good activity in the $5 – 6.5 million price range, where contracts are up, and September 2022 sales were better than September 2021 sales.
The one area where we are continuing to see noticeable weakness is the over $10 million market where we have 34 listing up 64% from last year with only 8 sales and no contracts. This works out to 38 months of supply. Of course, that is better than the 49 months of supply we had for this price range in September 2019.
For people looking to sell their house, the biggest issue they have to face, is the attitudinal shift among buyers. Prospective buyers don’t feel in a rush to buy and can be put off, by even minor issues. Some buyers expect that prices will fall, and they will get a better deal later.
Once they actually find a house, the story is often different from their perceptions if they are looking under $4 million. There we still have plenty of buyers for the small inventory that we do have. On the flip side, many sellers also have had an attitudinal change and are willing to be more accommodating. For those buyers, that are willing to take a risk, now is a good time to be making offers.
Stay tuned to see if inventory will continue it’s rise and if high-end sales really have shifted to the 4th quarter as we have seen in prior years.
Stay up to date on the latest real estate trends.

Blog
What RealTrends Verified Actually Means for the Greenwich Streets Team

Blog

Blog

Blog
What the Numbers Actually Mean for You

Blog
What Every Greenwich and Stamford Pet Owner Should Know

Blog
What Actually Matters (And What Doesn't)
Market Report

Stamford, CT
We have 8 options for you

Blog
Discover the best places to live across Greenwich
We are a dedicated group of Greenwich natives. We have a deep passion for our hometown and enjoy everything the town offers its residents from the beach front to the backcountry. That is why we don’t find you just any home, we find you the right home.
MARK PRUNER
DENA ZARRA
RUSSELL PRUNER
COMPASS
200 Greenwich Ave
3rd Fl Greenwich, CT 06830