May is Another Record, but is This the Inflection Point?
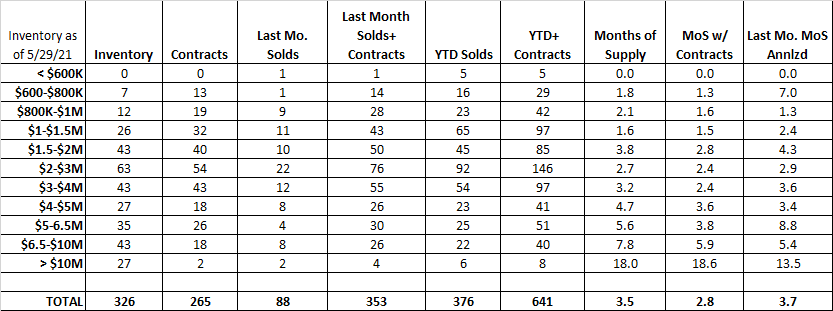
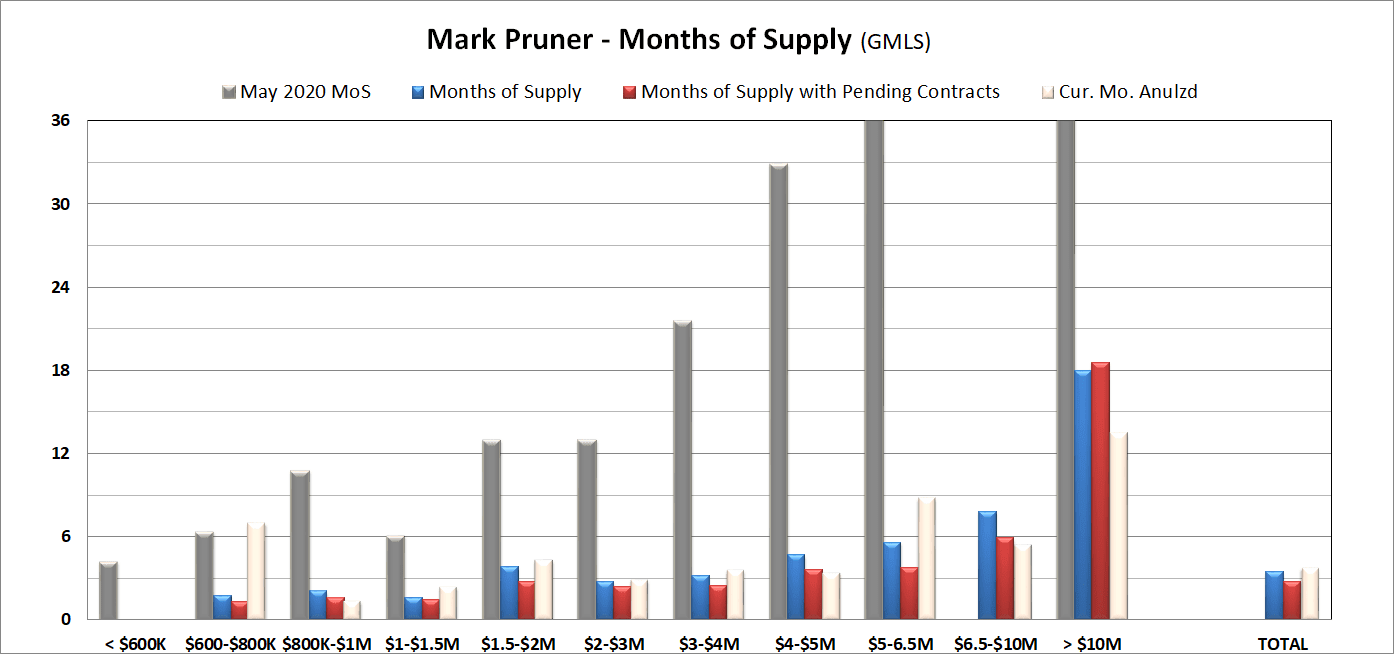
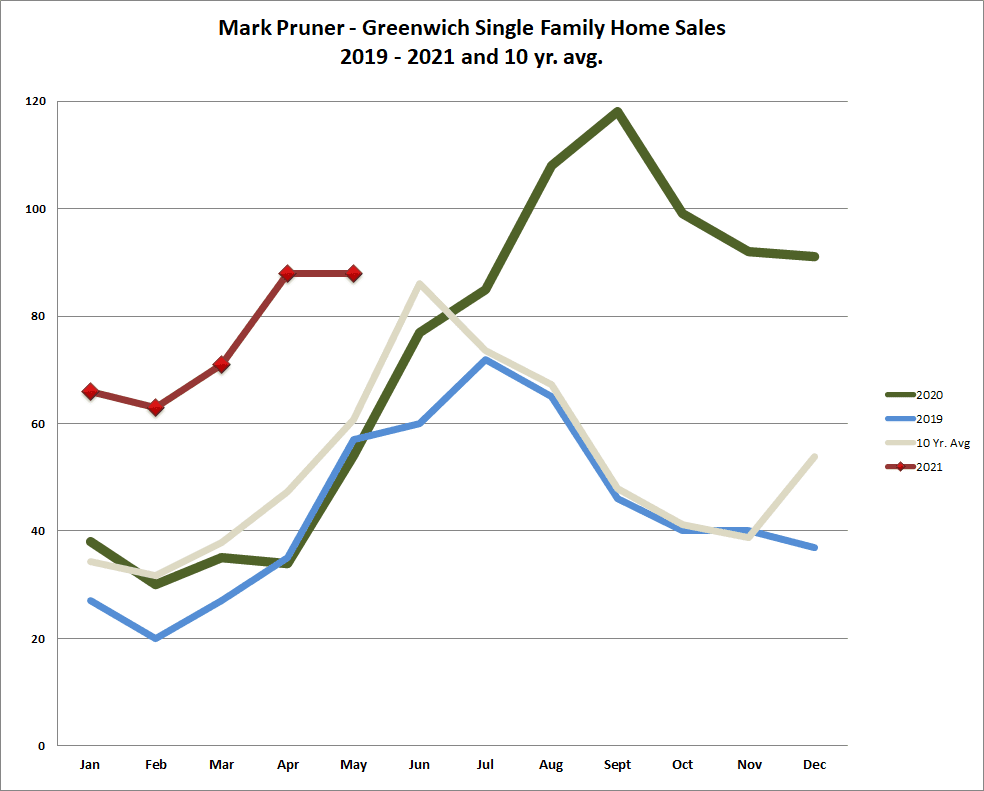
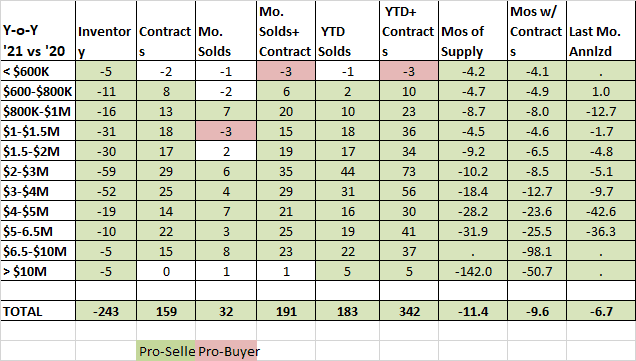
May 2021 was an interesting month in Greenwich. We had the same sales in May as we had in April at 88 sales. Our 10-year average for April sales is 47 sales and for May it is 61 sales, so both month’s sales are well above average. In fact, April and May are all time records for their respective months going back to 1999 when the GMLS records start. Townwide we are still at a ridiculously low 3.5 months of supply down 11.4 months from last May when we were in the heart of the pandemic shutdown. However, when you look at the details, our market seems to be going from very hot to hot.
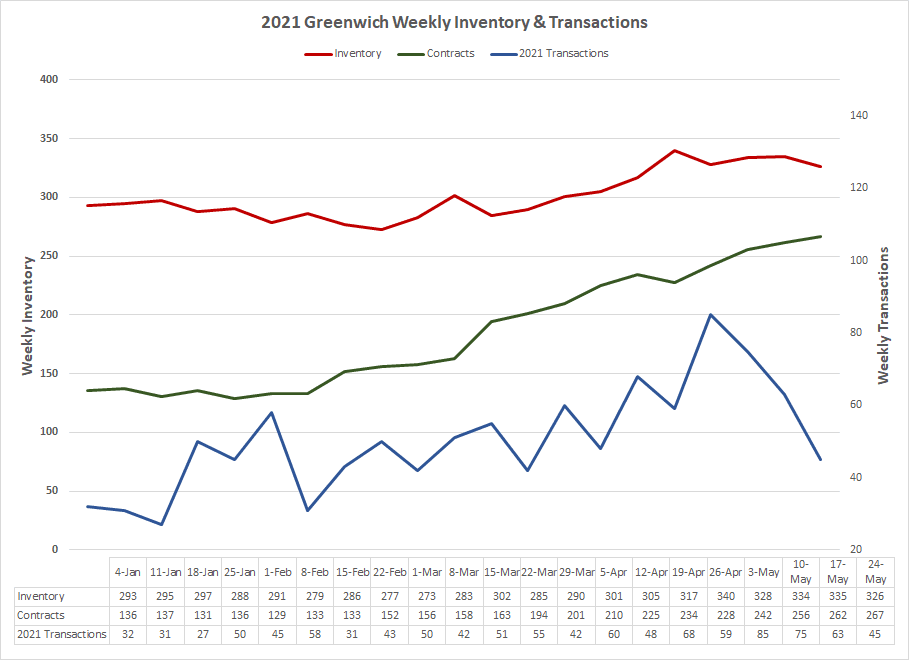
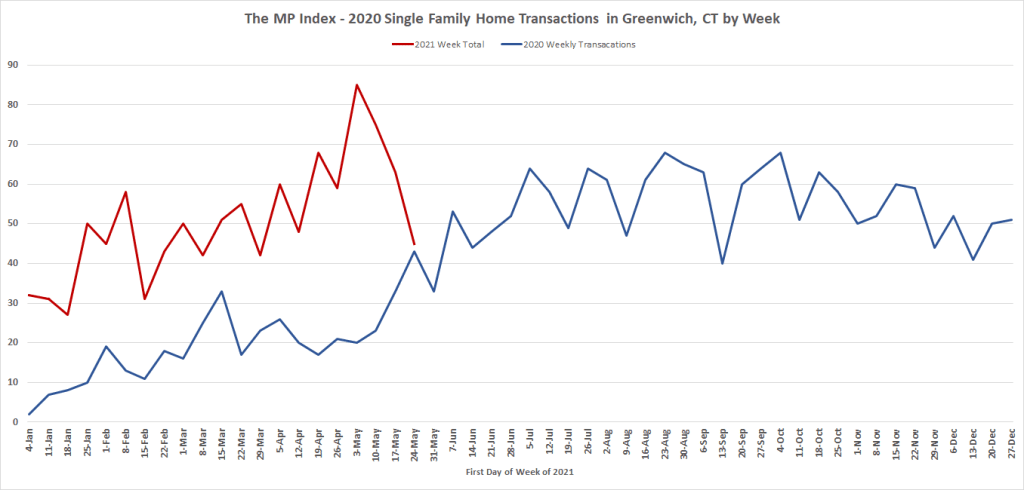
When you look at weekly transactions our high this year was the first week of May with 85 transactions, (sales and contracts). By the last week of May we were down to 45 transactions in that week, which looks like a big drop until you look at contracts. Our contracts are at their highest level all year with 267 contracts up from 242 contracts at the beginning of May and only 136 contracts at the beginning of 2021. The number of contracts is like a bucket with a hole in it. For the level of contracts to go up, you have to fill the bucket with new contracts faster than the number of sales is draining away contracts.
Personally, I think part of what we are seeing is people breaking out of their Covid induced home confinement. In May, my wife and I went on a 4-day vacation, the first time we’d been on a plane in 15 months, we went to an indoor wedding (with an outdoor dinner), had my brother’s family over sans mask and I just went to a friend’s funeral indoors at the Hyatt. Things are getting back to normal.
The result has been a market that slow down a little in May, but even at the end of the month it was still well above average. We are very likely to see sales go up in June as the number of contracts waiting to close says May was probably a pause for people to celebrate the beginning of the transition to normalcy.
If you go back to May of 2018, our last year with somewhat normal sales, we are
- Inventory is down 361 listings or 53%
- Contracts are up 133 or an increase of 101%
- YTD sales are up 170 or 83%, and
- May 2021 sales are 35 sales greater than May 2018 or 66%
We barely saw a rise in inventory in March and April; months when the spring market listings normally cause big jumps in inventory. In May our inventory has been flat. We started the month with only 328 listings, and we finished the month with 326 listings. On the contract side we started with 242 at the beginning of May and by the end of the month we were up to 267 contracts. Both of these numbers are “holey bucket” numbers that are pushed up by one factor, new listings and contract signings and pulled down by another factor, contracts and closings.
When listings are rising, we are seeing more houses come on the market than are going to contract. In years past, we also had a fair number of listings expiring unsold pulling down the number of listings. We are not seeing as much of that this year. Last year in the first 5 months of the year we had 92 listings expire. This year we have had 69 listings expire or a drop of 25%. This proves that even in the hottest market you can still overprice a house.
What’s amazing is how contract signings this year have been matched by the number of new listings coming on the market, and that continued in May. We are actually up 60% in listings this year, but our increased pace of contract signings and closings have kept our inventory from rising. With the number of weekly transactions falling May, I would expect that we will start seeing our inventory rising.
Of course, we could see listings fall, to balance out the reduced transactions, but there is no inherent reason why listings should match contracts, in fact the reverse is true. Our market has a major seasonal factor with listings rising in March and April, contracts being signed in April and May and sales peaking in June and July. None of that happened last year. In 2020, the whole market froze, both listings and contracts from the middle of March to the middle of May. We then started climbing through the middle of July.
Most of those first half sales were our family market. We didn’t start seeing significant increases in our high-end market until July, when the unrest in New York City spurred people to look for a second home. We continued at a high sales rate through October, when we saw some seasonal drop in activity, but we were still well above what we normally saw in the months of November and December.
This year we started off at high level in January. We had an excellent February and transactions accelerated in March and April. May has been busy, but our transactions dropped back though the month, but still at well above average levels. June will tell whether May was an inflection point or whether it’s just indicative of our volatile market.
I expect that our sales will continue high as WOOFH (Working Occasionally or Often From Home) continues to be a major factor shaping our housing market. It is clear that the U.S. is not going back to doing business the way it was done pre-pandemic. Companies have seen that they don’t need their employees altogether every day from 9 – 5 pm. As a result, space needs are declining in the office market and increasing in the home market. Until we reach a new equilibrium between office and home space our sales will continue to be elevated, but the question is just how much.
Stay tuned.