How COVID Changed the Greenwich Real Estate Market
by Mark Pruner
In March 2020, the world was thrust into a period of uncertainty and fear as the COVID-19 pandemic took hold. As governments implemented emergency orders and restrictions, the real estate market in Greenwich, Connecticut, felt the impact.
Covid Changed the Real Estate Market as the Epidemic Spread
The issuance of numerous emergency orders by Governor Lamont reflected the gravity of the situation, affecting every aspect of life, including the real estate industry. Buyers and agents quickly adapted to the new normal, implementing safety protocols during showings. Masks, gloves, and booties became standard attire, while prospective buyers had to refrain from touching anything, instead relying on agents to open doors and provide necessary access.
In response to these challenges, new ways of doing showings developed. Window peeping tours were invented, allowing potential buyers to view properties from outside. Additionally, virtual tours via FaceTime or other video platforms became popular alternatives to on-site showings. Even with fear in the market, these restrictions only held the market back for a couple of months.
Pre-Covid Our Market had Been in a Gradual Decline
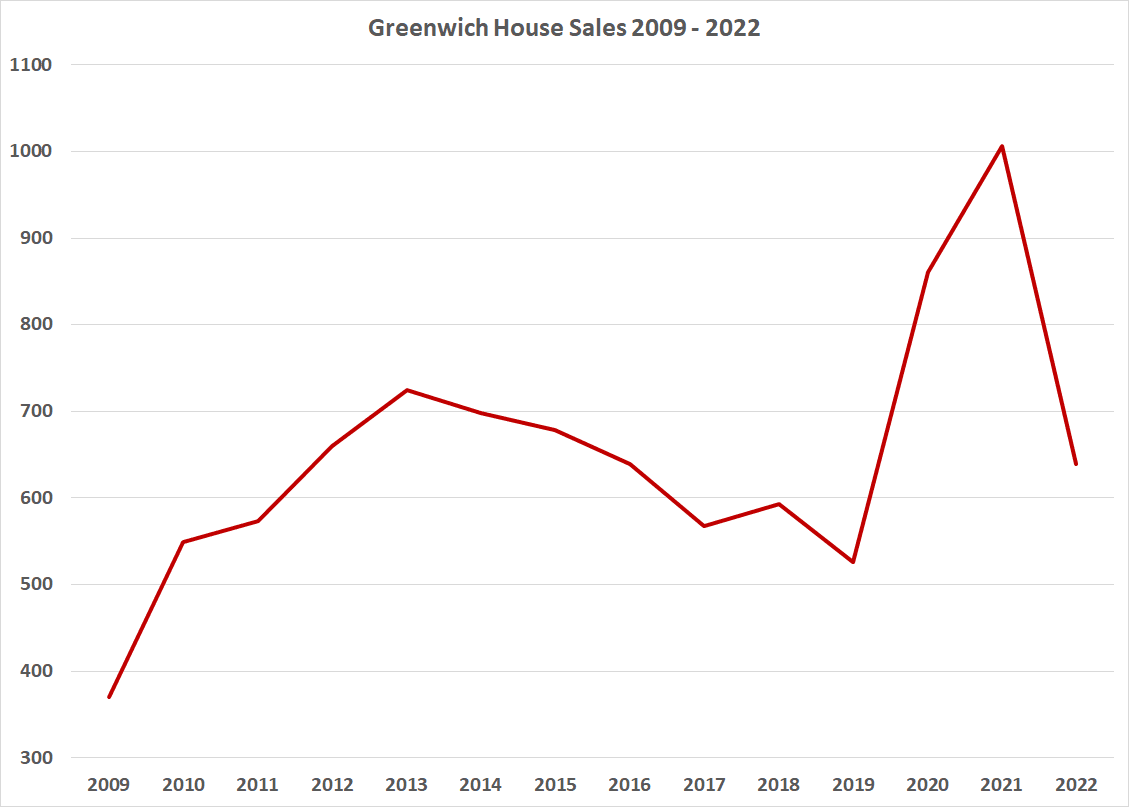
To get a better feel of just how much Covid and the shift to working from home changed the market, it’s helpful to see what was happening the market pre-Covid. The Great Recession resulted in our lowest annual sales ever with only 370 single family homes sold. For the next four years sales rose sharply peaking at 724 sales in 2013 reminiscent of the boom years of the digits decade.
Starting in 2014, the market experienced a slow decline in sales for the next 5 years. In 2014k we recorded 698 sales, 2015 had 678 sales, both above average years. In 2016 we dropped to 639 sales, with a further decline to 568 sales in 2017. This steady four-year decline amounted to a 22% decrease in sales.
The Trump Tax Act and the Turnaround in 2018
Our only uptick in sales in the seven-year period from 2013 to 2019, was in 2018, and it wasn’t a big jump. Sales climbed to 593 single-family homes sales in 2018, breaking the downward trajectory of the previous years. The catalyst for this change was the Trump Tax Act which kicked in that year. One provision limited the deduction of state and local taxes to only $10,000. This change prompted many individuals to relocate from Westchester County, known for its high property tax rates, to Greenwich, with the lowest tax rates in the New York metropolitan area.
The Challenging Year of 2019
While 2018 showed promise for the market, the subsequent year, 2019, proved to be challenging. The influx of individuals moving from Westchester County to Greenwich slowed down, while many Greenwich people sought low-tax jurisdictions outside Connecticut with Florida being a particular favorite. As a result, in 2019, only 526 houses were sold, marking the lowest sales figure in the past 20 years, except for the two years of the Great Recession in 2008 and 2009. At the beginning of 2020, sales were up significantly over 2019, which looked promising. Then along came Covid.
The Impact of Covid and the Road to Recovery
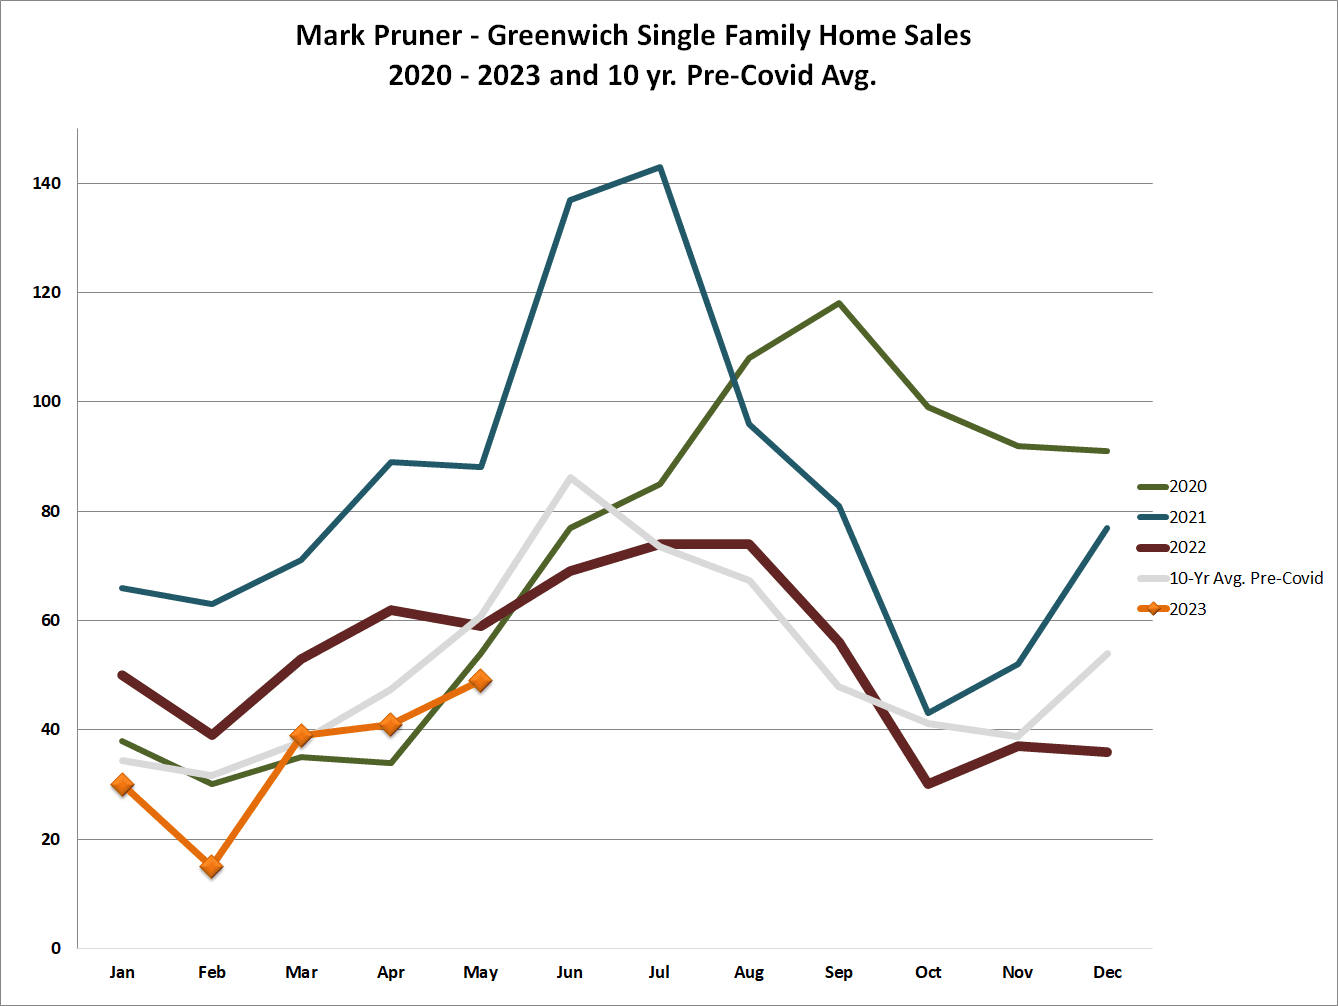
The COVID-19 pandemic posed unprecedented challenges for the Greenwich real estate market. The initial months of the pandemic brought about a decline in real estate sales in Greenwich over our 10-year average. In April 2020, sales dropped by 20%, from the prior April with only 34 sales recorded compared to our 10-year average of 47 sales in April. Lower sales continued in the first half of the year, as home sales experienced a dip month after month compared to our 10-year average.
The Unprecedented Boom
As the second half of 2020 unfolded, the market saw a remarkable turnaround. Sales began to surge, defying expectations and fueling a resurgence in Greenwich real estate. From July 2020 to April 2022, Greenwich saw a remarkable jump in demand. Starting in August 2020 and in every subsequent month we set a new, all-time record for monthly sales, with two exceptions that were just barely below an all-time record.
In June 20211, we set an all-time monthly record of 137 single-family home sales. The next month we broke we broke even that record. The pinnacle of the boom occurred July 2021, with a staggering 143 sales, almost double the average of 74 sales for that month. It wasn't until 10 months later in May 2022 that the market slipped below the 10-year pre-COVID average. After May last year monthly sales were similar to our 10-year average with 639 sales, just above our 10-year average of 621 sales.
Sales Decline with Lack of Inventory in 2022
The drop in sales in second half of 2022 was principally due to a shortage of available houses on the market. Demand remained strong, but the limited inventory restricted the number of transactions. As remarkable as the Covid period sales were, they were actually significantly higher as we had a lot of uncounted off-market sales during the height of Covid. These sales continued in 2022, as agents would mention they had a listing coming on, only to have a fellow agent, said they had a motivated buyer. As a result, that listing never saw the public market.
During Covid, the combination of low interest rates, an increased desire for spacious homes due to remote work, and the perception of Greenwich as a safe haven during uncertain times fueled the demand.
How Inventory Allowed for Record Sales and Caused a Drop in Sales.
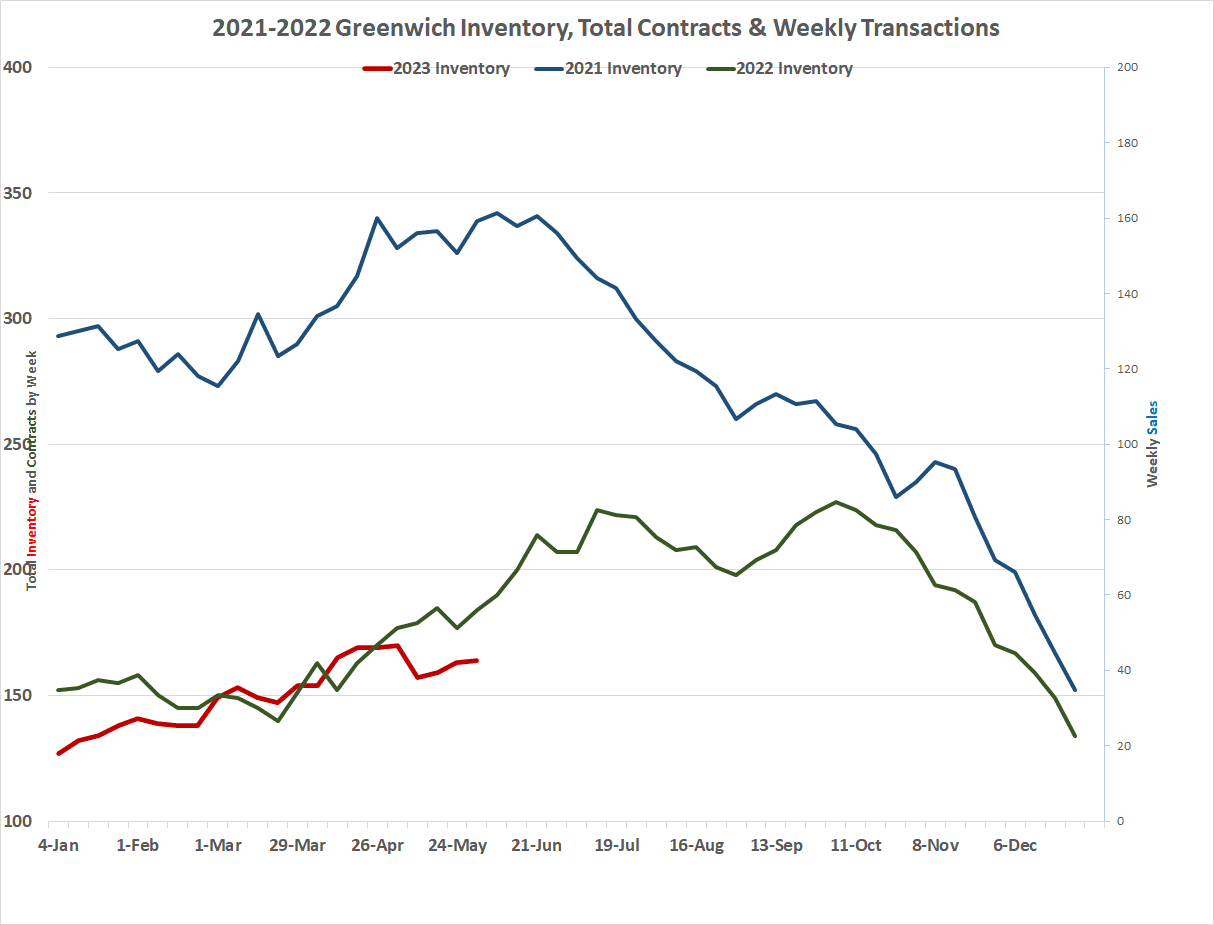
The remarkable sales figures of 2020 and 2021 would not have been possible without a large influx of new listings. Many sellers didn’t want to list their houses in the pro-buyers’ market of 2018 and 2019. They opted to hold off on listing their properties during that period, leading to the accumulation of the so-called shadow inventory. Traditionally, inventory in Greenwich peaks in April or May, with approximately 650 listings. However, in 2019, despite reaching a peak of 738 listings on the Greenwich Multiple Listing Service (GMLS), only 526 houses were sold. During peak sales of 2021, we saw a different scenario, with a peak inventory that year of only 342 listings.
More Inventory Means Less Sales and Less Inventory Means More Sales
So, in 2019, we had plenty of inventory and we only had 526 sales, while in 2021, we had low inventory and twice the sales. How could that be? Part of the dramatic drop in 2021 inventory was because a lot of listings in 2021were never counted in the monthly inventory figures, because they went to contract so fast.
In a hot market, a new listing can go to contract in a week or two. If that one- or two-week period is within the same calendar month, that listing isn’t counted when the month-end inventories prepared. As a result, inventories look low, while there are actually enough new listings to support demand. That is what happened in 2020 and 2021. Inventory went down, but the shadow inventory that had accumulated in prior years came on the market to meet demand.
In the second half of 2021, our inventory began to decline significantly every week as the reservoir of shadow inventory was used up. At the same time demand stayed high and our days on market continued to decline.
Low Inventory Challenges in 2022 and Beyond
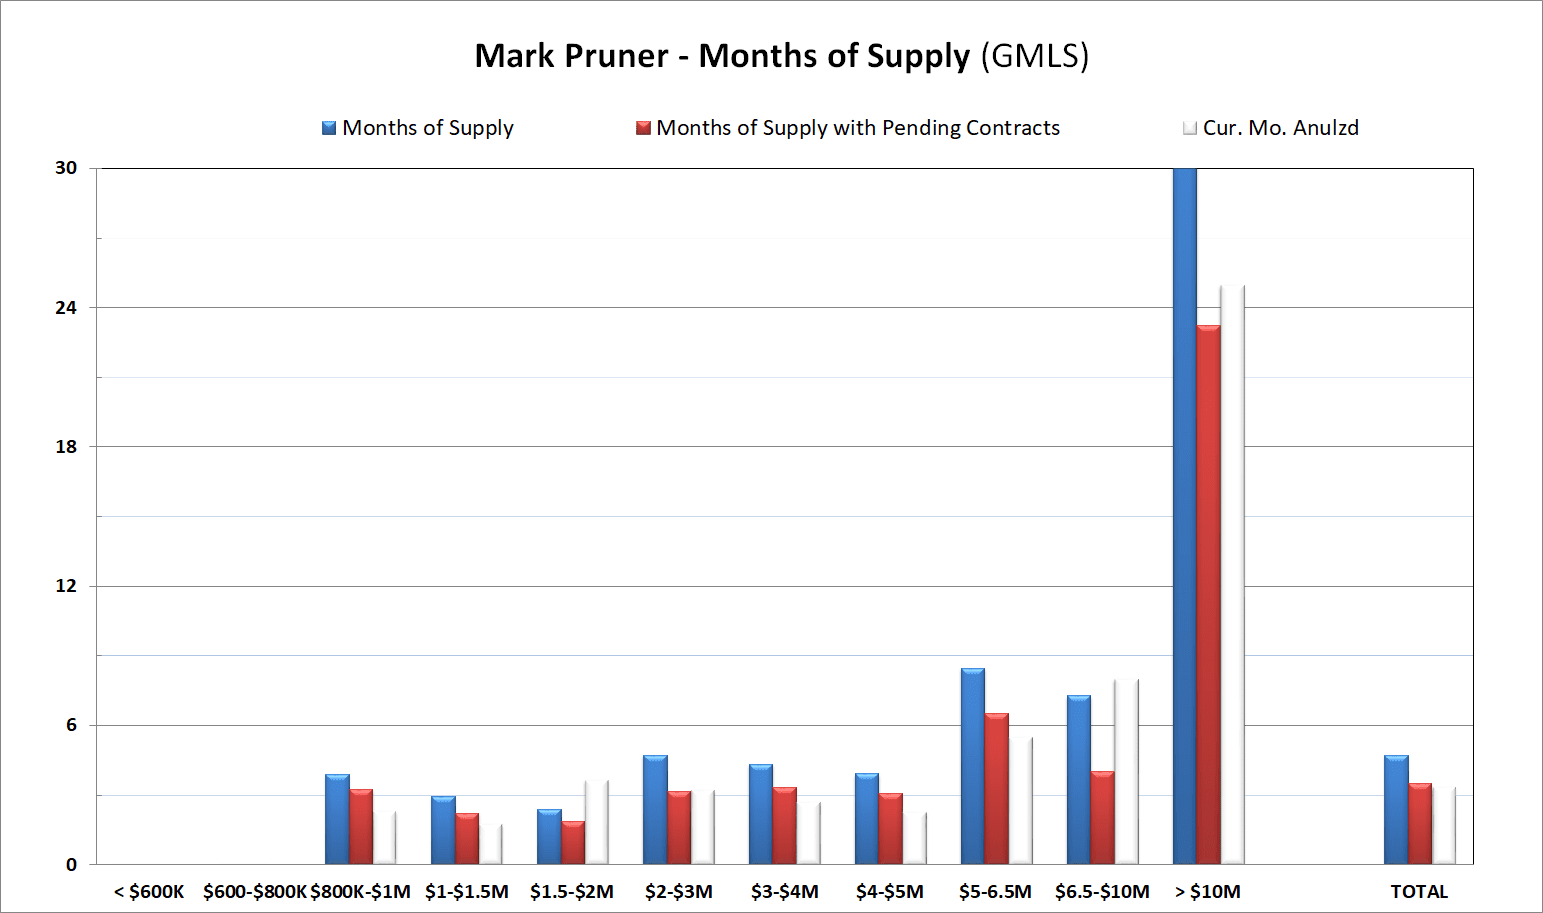
In 2022 our inventory of single-family homes for sales peaked at 227 listings. As of June 2023, the inventory in Greenwich stands at a mere 163 houses. While higher interest rates have contributed to some reduction in demand, the drop in listings has been far more significant. If we had more listings, we would have many more sales. This is shown both by lower days on market and very low months of supply.
Causes of Low Inventory
Several factors have contributed to the low inventory levels in Greenwich. First, higher interest rates have locked in some owners who have much lower interest rate loans. They don’t want to sell their houses and downsize only to end up with higher monthly mortgage payments. Secondly, a state of gridlock has emerged, as homeowners who would like to sell their homes can’t find a condo or a house to buy. This gridlock perpetuates the low inventory, but it also means that as more inventory eventually does come on the market that inventory may recover quickly. More inventory to buy means more people willing to sell.
What’s Next
The Greenwich real estate market faces a significant challenge due to the dramatic drop in active inventory and the disappearance of our shadow inventory. While higher interest rates have reduced demand to some extent, the shortage of listings remains the primary constraint on sales. If you are seller, it’s a great time to list your house. If you are a buyer, you want to be prepared to move quickly on the “good” listings that come on the market or be willing to do some work to modernize our older houses that are selling slower than their like new competition.
We have seen repeated predictions of a looming recession, but our inventory is so low that it would take quite a shift in the economy, interest rates and the stock market, before we would see anything like a buyer’s market under $4 million in Greenwich.