High Demand for High-End, Little Inventory for the Lower-end
Last year was an amazing year for rentals in Greenwich. Our overall rentals were only up 25% for the year compared to our 10-year average, but rentals over $12,000 per month were up 233% from 60 rentals to 200 rentals. Above $20,000 per month, our rentals were up 468% from 14 rentals in a normal year to 79 rentals in 2020, and, those numbers are certainly an undercount. The rental market was so hot, that many listings never made it to a public listing in 2020. If you had a rental listing with a pool last year and let your fellow agents in your office know, three other agents would announce they had someone that wanted to rent it.
This year we are seeing the number of rentals return to more normal numbers, but the mix is different. Rentals below $8,000 are down in 2021, while rentals above $10,000 have doubled. This seemed curious, so I talked to our rental guru here at Berkshire Hathaway, Roberta Jurik, who said that people don’t seem to be moving around as much this year compared to prior years. The uncertainty of people’s office situation means they are often staying in place.
| |
10 Yr. Avg |
2020 |
2020 vs 10 yr Avg |
2021 Anlzd |
2021 Annlzd vs. 2020 |
2021 vs 10-yr avg |
| 1-2000 |
129 |
71 |
-45% |
70 |
-2% |
-46% |
| 2001-4000 |
322 |
350 |
9% |
283 |
-19% |
-12% |
| 4001-6000 |
161 |
192 |
19% |
137 |
-29% |
-15% |
| 6001-8000 |
83 |
101 |
22% |
60 |
-41% |
-28% |
| 8001-10000 |
52 |
77 |
47% |
60 |
-22% |
15% |
| 10001-12000 |
29 |
50 |
71% |
43 |
-14% |
47% |
| 12001-14000 |
16 |
36 |
128% |
36 |
0% |
128% |
| 14001-16000 |
14 |
28 |
99% |
29 |
3% |
104% |
| 16001-18000 |
10 |
32 |
208% |
7 |
-78% |
-31% |
| 18001-20000 |
6 |
25 |
331% |
14 |
-42% |
148% |
| >20001 |
14 |
79 |
468% |
72 |
-9% |
418% |
| Grand Total |
836 |
1,041 |
25% |
811 |
-22% |
-3% |
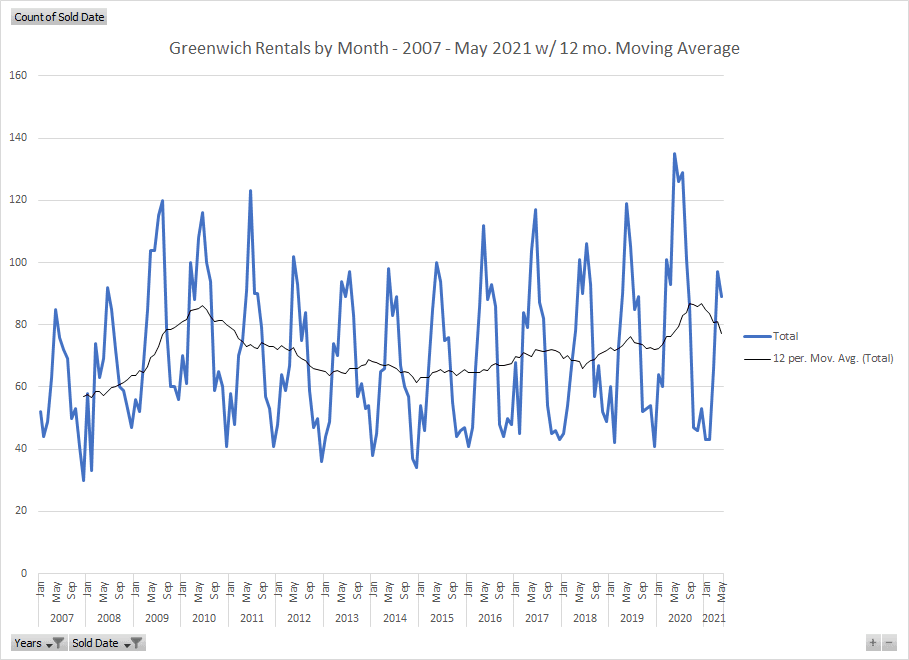
The pandemic increased sales about as much as we saw in the depths of the Great Recession. In the recession, sellers, particularly developers couldn’t sell their houses, so they decided to rent. Also, many people who could buy decided not to do so not wanting to buy a declining asset. By 2012, we were back to a “normal” rental market of 780 to 860 rentals per year. In the post-recession years from 2012 to 2019, our rental market was fairly steady within those bounds. Our rental market was also fairly tight with most properties renting in weeks or a couple of months as our rental market is always tight below $6,000/month where the majority of rentals is.
In 2020, demand for homes took off as people wanted to get out of NYC. This increase in demand resulted in increased prices and this led to a big jump in inventory, which led to more home rentals. People who never would have considered renting their houses were happy to do so if they could $30,000 or $50,000 or more per month. Below $2,000, the number of rentals actually dropped as people who wanted to get out of apartments in NYC were not jumping to move into an apartment in Greenwich that also had shared hallways and elevators. Also price appreciation was pushing up the asking price for rentals above $2,000. This is particularly true with single family homes where they was big demand and significant price appreciation.
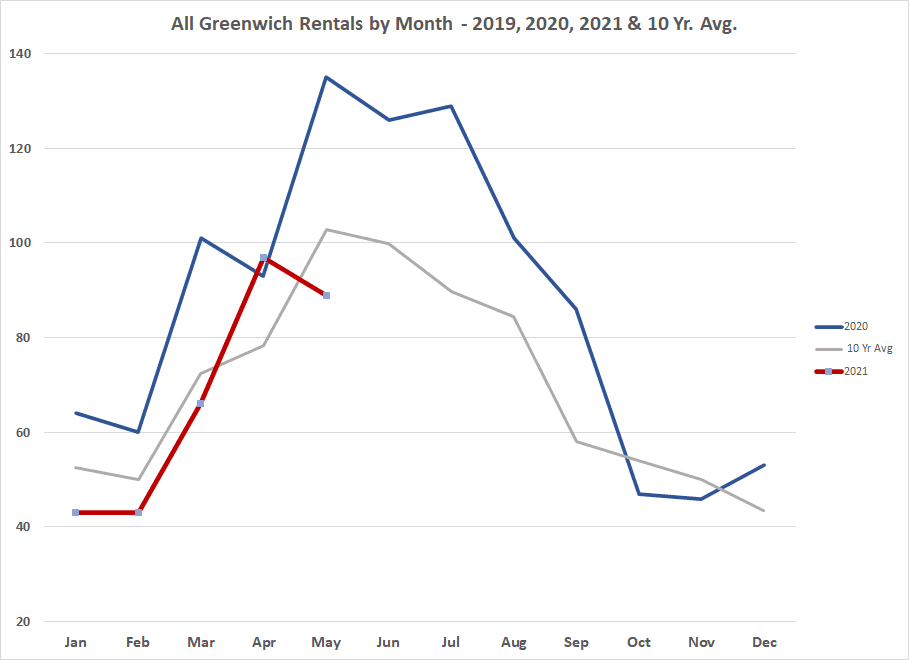
Once the pandemic hit in 2020, people did not wait around. Our rentals took a huge jump in March of 2020 and stayed high all the way to October when rentals started to return to normal. In 2021 with an estimated 811 rentals if you an annualize our first 5 months of rentals, it looks like we have dropped back to an average year, but that conceals major changes in demand by price range.
In 2020, our rentals under $2,000 were down by 45%. Annualized rentals our first five months of rentals under $2,000 are down an almost identical 46%. Part of this is a continuing reluctance to rent apartment style units, but much of it is just that we have have fewer units under $2,000 per month as prices have been pushed higher. Also as noted by Roberta Jurik, we are seeing fewer rentals come to market as people are waiting in place. Above $4,000, our rentals were up at all price ranges over the 10-year average, but particularly above $10,000/mo.
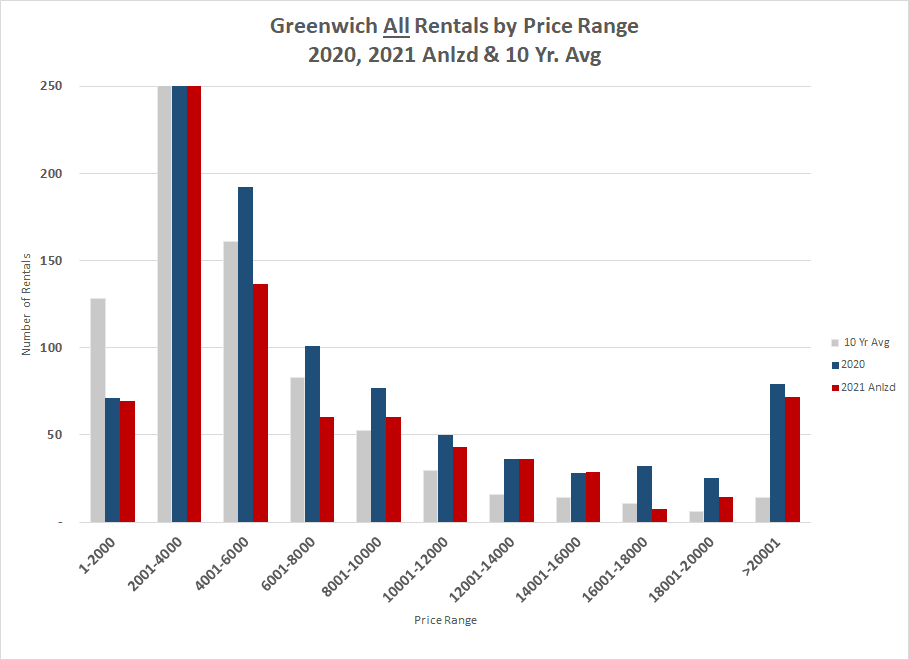
Above $10,000 our 10-year average of rentals is only 89 houses, but in 2020 that jumped 181% to 250 high-end rentals. If you annualize the first 5 months of rentals in 2021 we are on a pace to rent 202 houses above $10,000 a drop of 19%, but still 127% above our 10-year average. Above $20,000 per month, rentals jumped from the 10-year average of 14 to 79 rentals or 464%. At the present pace we will see about the same number of high-end rentals in 2021. Part of the increase in high-end rentals may be driven by the millionaire tax in New York encouraging high-income families to spend less than 6 months in NY and NYC.
Non-listed rentals
We have more rentals each year in Greenwich on the Greenwich Multiple Listing Service than we have house sales, but this is not all the rentals in Greenwich. Under $2,000 the majority of listings are done privately; either listed in the newspaper or put on Craigslist. Under this price we have between 100 and 150 rentals per year on the GMLS. The units available under $2,000 include everything from a one-room-garage apartments to smaller condos throughout town. If a place is livable in Greenwich and listed for under $2,000/mo. it goes pretty quickly.
We have more rentals each year in Greenwich on the Greenwich Multiple Listing Service than we have house sales, but this is not all the rentals in Greenwich. Under $2,000 the majority of listings are done privately; either listed in the newspaper or put on Craigslist. Under this price we have between 100 and 150 rentals per year on the GMLS. The units available under $2,000 include everything from a one-room-garage apartments to smaller condos throughout town. If a place is livable in Greenwich and listed for under $2,000/mo. it goes pretty quickly.
Inventory or lack thereof
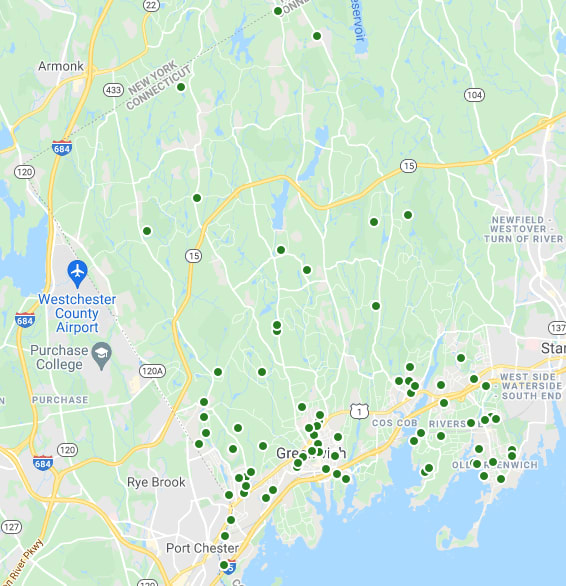
As anyone knows who has been looking for a rental our rental market is very tight. At the present time we only have 91 rentals of any type listed on the GMLS. If you are looking between $10,000 and $12,000 you have a choice of two houses. If you are looking in Riverside from $7,000 to $12,000 you have a choice of three rentals. The low inventory in the rental market makes the sales market look easy and it’s not.
|
Monthly Rent
|
Inventory |
| 1-2000 |
5 |
| 2001-4000 |
28 |
| 4001-6000 |
11 |
| 6001-8000 |
12 |
| 8001-10000 |
8 |
| 10001-12000 |
2 |
| 12001-14000 |
4 |
| 14001-16000 |
4 |
| 16001-18000 |
2 |
| 18001-20000 |
4 |
| >20001 |
11 |
| Grand Total |
91 |
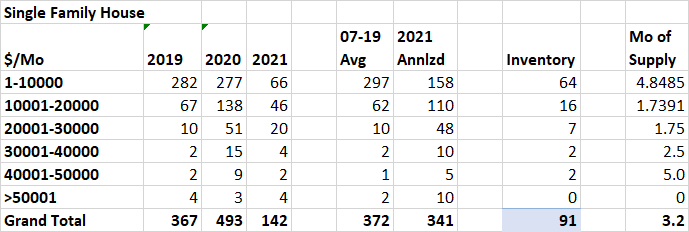
As mentioned at the lower price points most of our inventory consists of a variety of apartments, condos, garage apartments and the occasional small carriage house. From $4,000 to $6,000 we are about evenly split between single family houses and all other types of rentals. Above $10,000 per month nearly all of our rentals are single family homes. Overall, we normally are about evenly split between single family homes and all other types of rentals. This year 60% of our rentals are single family homes. If you are not looking for a house to rent, then you only have 37 listings to choose from. The result, says Roberta Jurik, is that we are seeing a lot more multiple offers in lower price ranges in 2021.
Even though Greenwich is considered a high-end town, when it comes to rentals 77% of our single-family home rentals in 2021 are below $10,000 and with lots of competition. Our high-end rentals are way up, but we also see 60% of our single family listings in that category. The result is that our overall days on market is down. We normally average around 74 days on market, but 2020 that dropped to 64 days and so far in 2021 we are down to an amazing 33 days on market.
It’s a good time to be a landlord.