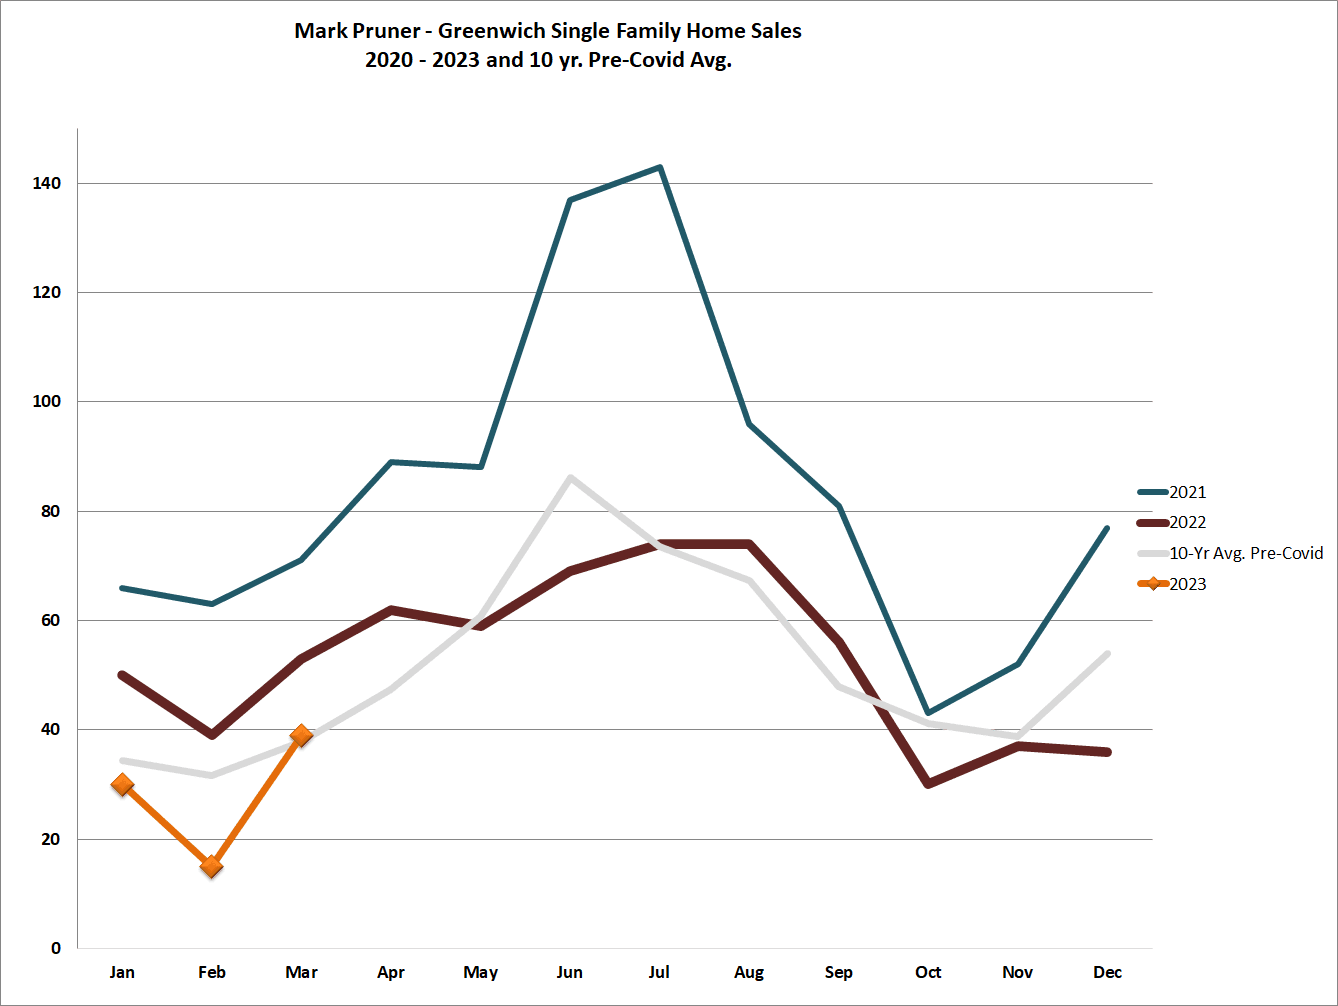
Sales are looking up in March 2023, which is a good thing, because, the first quarter was a downer. In March, we had 39 single family home sales compared to our 10-year pre-Covid average of 38 sales or one more sale than average. Those 39 sales in March were more than double the 15 sales that we had in February of this year. For the moment we are back to average on at least one stat, after a scary first 60 days.
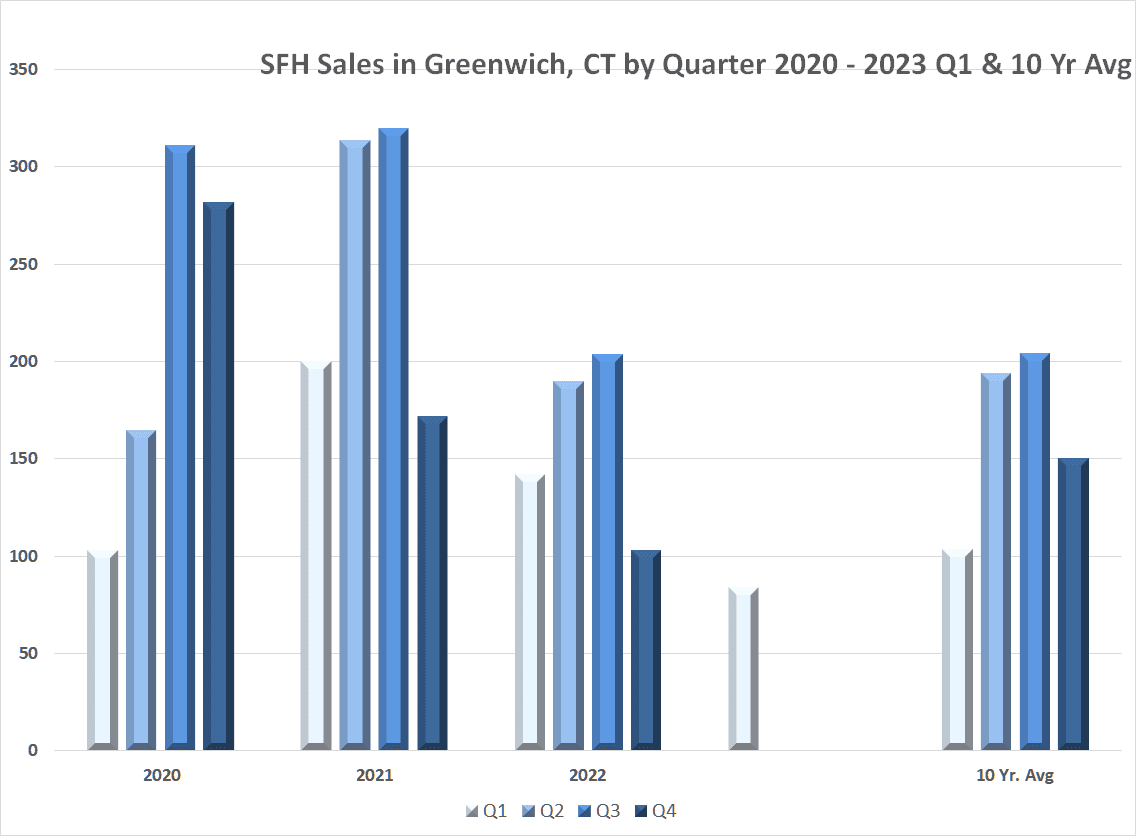
Unfortunately, for the quarter our 84 sales are the lowest since the first quarter of 2019, when we had only 74 sales. To go even lower than that you have to go back to the heart of the Great Recession. In the first quarter of 2009, we had an all-time low of only 35 sales in three months. One month does not make a trend, so which way is the market headed?
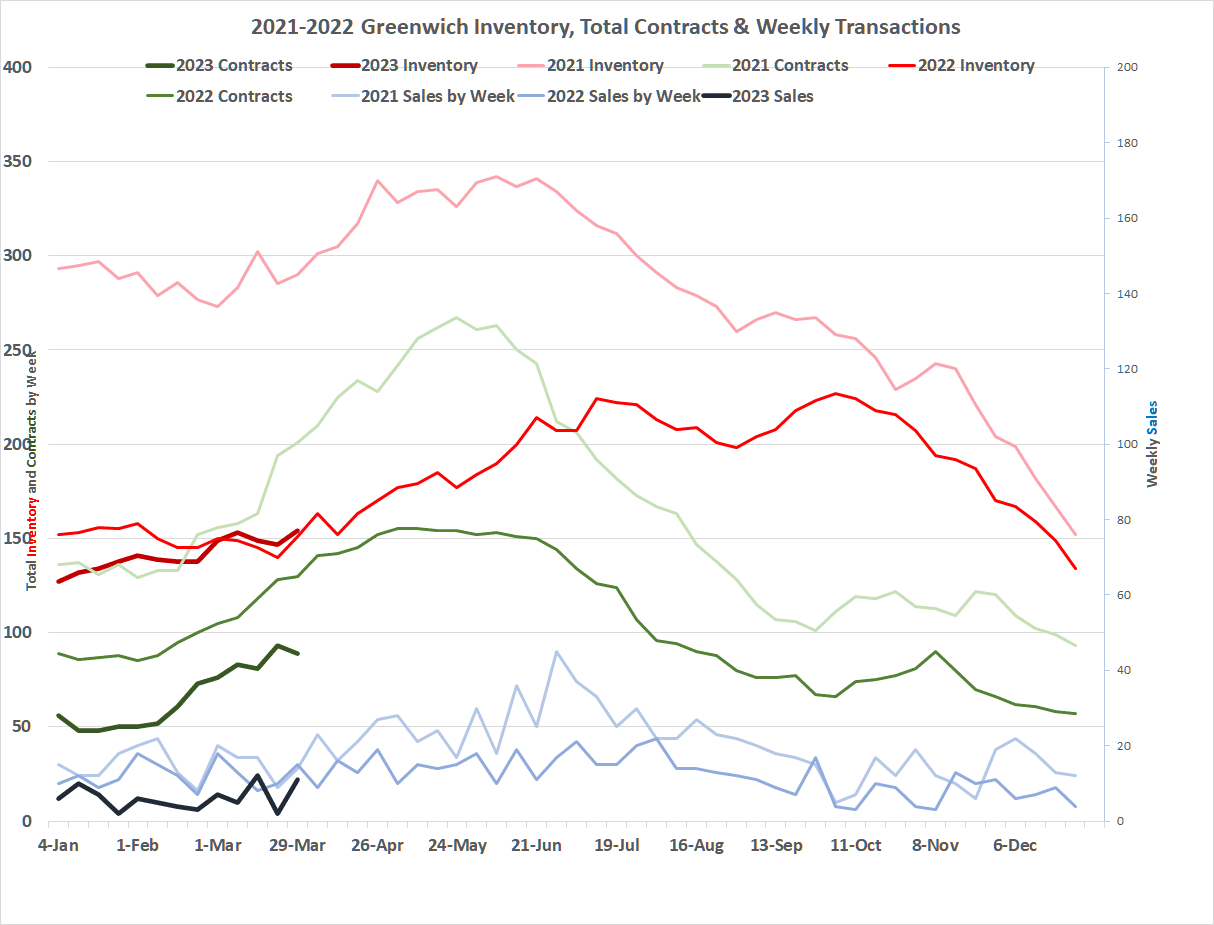
Let’s take a look at the numbers and see which way they point. While sales are down in the first quarter, we also saw the lowest inventory of homes for sales ever in Q1 2023, which is remarkable given how low inventory was last year. In 2022, we set a new record for low inventory every week of the year. For the first 9 weeks of 2023, we broke even those low records. This year we opened the year with an all-time record low of only 127 listings. You can’t sell what you don’t have, and we really saw that in January and February of this year.
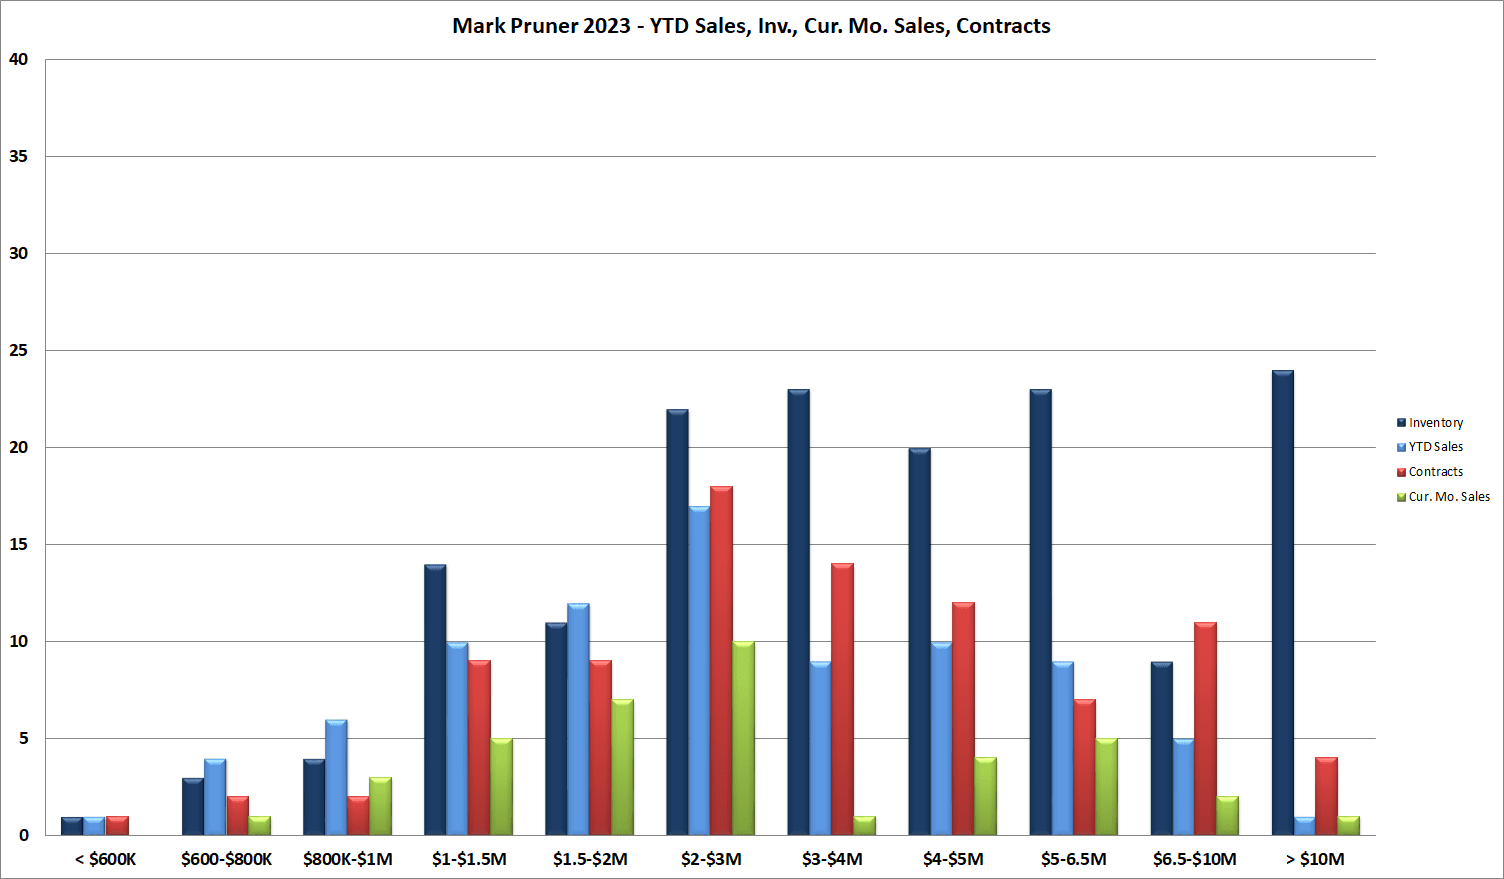
At the lower end of our price range, in the market from $800,000 to $1,000,000 we only had 2 listings in January down from 8 in January 2022 and down from 17 listings in January 2019. For those who like to impress your friends with big percentages derived from small numbers, we had 850% more listings between $800,000 and $1,000,000 in 2019 than we had at the beginning of this year. At the end of March, we went from 2 listings to 4 listings. At the same time, we’ve had 6 sales YTD and 2 more under contract so what comes on is selling quickly. In a few years we may have no listings under $1 million as price appreciation is pushing prices over $1,000,000 just as has happened to our sales under $600,000.
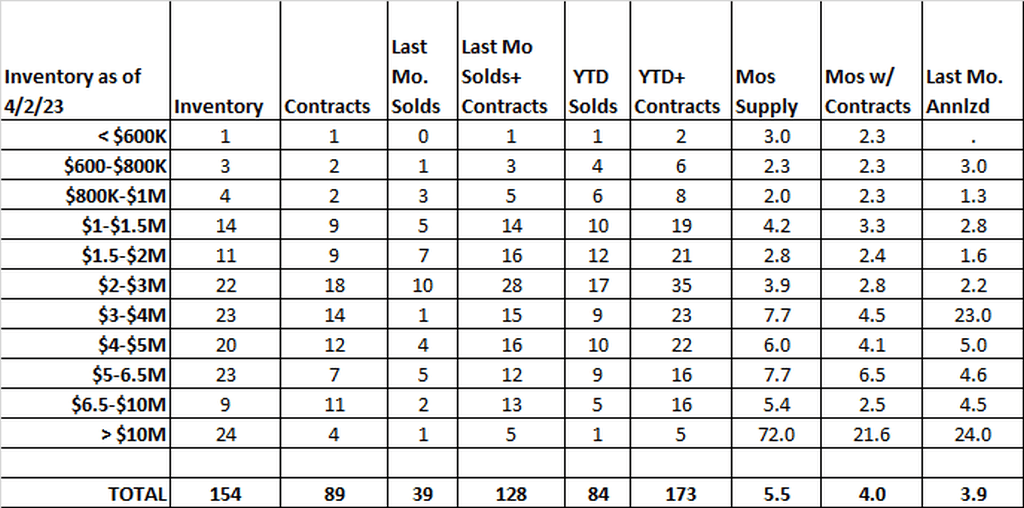
At the upper end of the price ranges, we started the year with 10 listings from $6.5 – 10.0 million. This compares to 24 listings in that price range in January 2022, while we had 42 listing in that price range in January 2019 or 420% more listings in 2019. As of the end of this March, we have only 9 listings from $6.5 – 10.0 million. We also have 11 contracts and 5 sales so far this year. Net we have the same number of total sales and contracts as last year in this high-end price range.
This, however, is high-end cherry picking. The over $3 million plus market is clearly weaker this year than last year. Inventory is up slightly even as new listings are down. Our sales and contracts are mostly lower than last year. If you look at the $3 – 5 million price range, we have 16 more listings now than we had at the end of the first quarter in 2022; 43 listings compared to last year’s 31 listings.
In March our weekly inventory counts for single family homes finally exceeded what we saw in the first part of 2022. With more inventory, we saw more contracts and more sales. Contracts rose from 72 contracts at the end of February to 89 contracts now. While sales went from the aforementioned abysmal 15 sales in February 2023 to 39 sales in March. The market is warming up as it does in spring markets in most years.
Having said that our March 2023, sales are down from 53 sales last year to 39 sales, even with more inventory. In a tight market you want to look at not only inventory, but also the total of new listings. In the first quarter of 2022, we had 200 new single-family listings. This year we have had only 166 new listings. This is a drop of only 34 listings, but what it means is that a tight market has gotten even tighter as we have less fuel/inventory to keep the market going.
With less supply, it’s hard to tell whether the drop in sales is due to less inventory or fewer buyers due to higher interest rates. Some buyers may think that if property prices are down due to higher interest rates, that the lower sales prices offsets most of the increase in interest rates. Buyers who think that are very wrong. Interest rates have jumped a lot, though not as much in Greenwich as the national press might want you to believe, while Greenwich houses prices are flat to up, depending on which stats you look at.
Higher interest rates are squeezing sales, for most of the U.S. where the nationwide median house price is under $400,000, and buyers are applying for conforming home loans for their home purchases. In Connecticut the conforming loan cut off is $726,000. The conforming loans have gone over 7% at times, even though these loans are often government insured.
In Greenwich, the rates buyers look at are the non-conforming, jumbo loan rates, which ironically are lower than the government insured rates for conforming loans. One major bank quoted their jumbo loan rates in March last year at 4.125% plus 0.125 discount points to buy the loan down to that rate. In March 2023, that jumbo rate had increased by only 1% to 5.125% plus 0.750 discount points. Interest rates for the Greenwich buyer have gone up 1% not the 6% jump in the Fed Fund rates that the financial press focuses on.
Having said that, buyers borrowing in the Greenwich market are being squeezed out of the market; not by higher interest rates, but by all cash buyers snapping up houses under $2 million where mortgages are traditional. Today, we have 87 contracts waiting to close. Of those 87 contracts, only 15 are contingent or 17%. Of the remaining 72 contracts that are ready to close, 15 of those 72 contracts had previously been contingent, but looks are deceptive here. Only 3 of that second group of 15 contingent contracts were likely mortgage contingencies.
The other 12 “contingent” contract went to non-contingent/pending in only a few days, too short a time to actually get a mortgage approved. So, what’s going on here? Part of this group are the normal, non-mortgage contingencies, that we see with Greenwich houses. Contingencies, like I’ll buy the house if I can build a pool house or will the neighbor with the encroaching fence agree to remove it should the buyer want them to, or can I have two llamas in this zone (seriously, I saw that contingency when I was a real estate attorney).
Many of these short-term contingencies are a back to the future movement. When I was a real estate attorney back in the 1980’s, the standard sales contract had two contingencies; a mortgage contingency like today and a short inspection contingency. Having an inspection contingency switched control of the deal from the seller to the buyer. Once signed, the seller was bound, and the buyer could decide whether to go forward or not depending on what the inspection showed.
By the 90’s this inspection contingency was disappearing as the sellers wanted to keep control of the deal. Today, after there is accepted offer, buyers have to perform and pay for an inspection. They have no guarantee that the seller will go forward with the deal, since the rule in Greenwich is that there is no deal until the contract is signed. Until then either party can walk away from the deal.
So why would a seller agree to put in an inspection contingency in a deal when waiting until after the inspection keeps them in control? While not common, I’ve negotiated two inspection contingencies in the past year. In both cases, my client had the best offer, but wouldn’t do the deal without a building inspection. The seller could go to the second offer, but didn’t want to give up the premium that my buyer was offering. In addition, the inspection contingency was only for a week. The seller took the money, the buyer got their inspection, and the other offerors were told to hang in there for a week. In a tight market, it can pay to get creative.
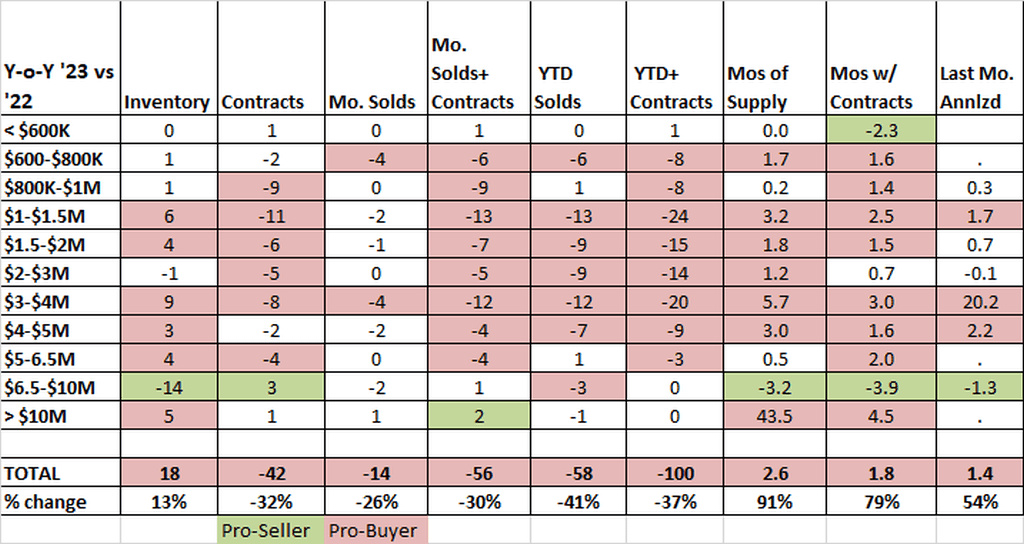
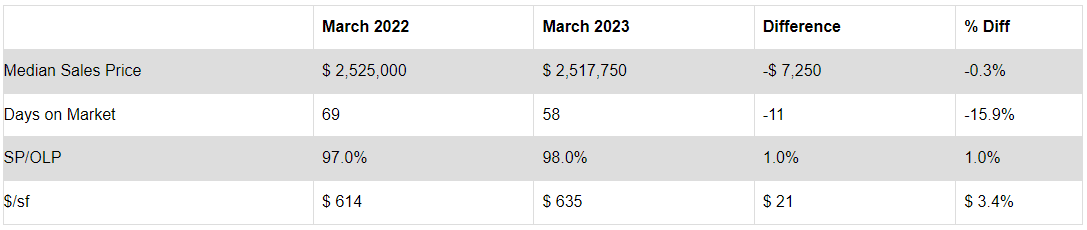
As before though is our market becoming more pro-buyer or more pro-seller. The answer to that is “Yes”. Our median price is down 0.3% from last year from $2.525 million to $2.518 million. At the same time, days on market has gone from 69 days on market in March of 2022 to only 58 days this year or a drop of 15.9%. People are moving quickly to get those few houses that come on and are in great shape. As further indication of that, our sales price to original list price ratio has gone up from 97% last year to 98% this year. We’ve also seen the sold price per square foot go from $614/sf last year to $635/sf this year or an increase of 3.4%.
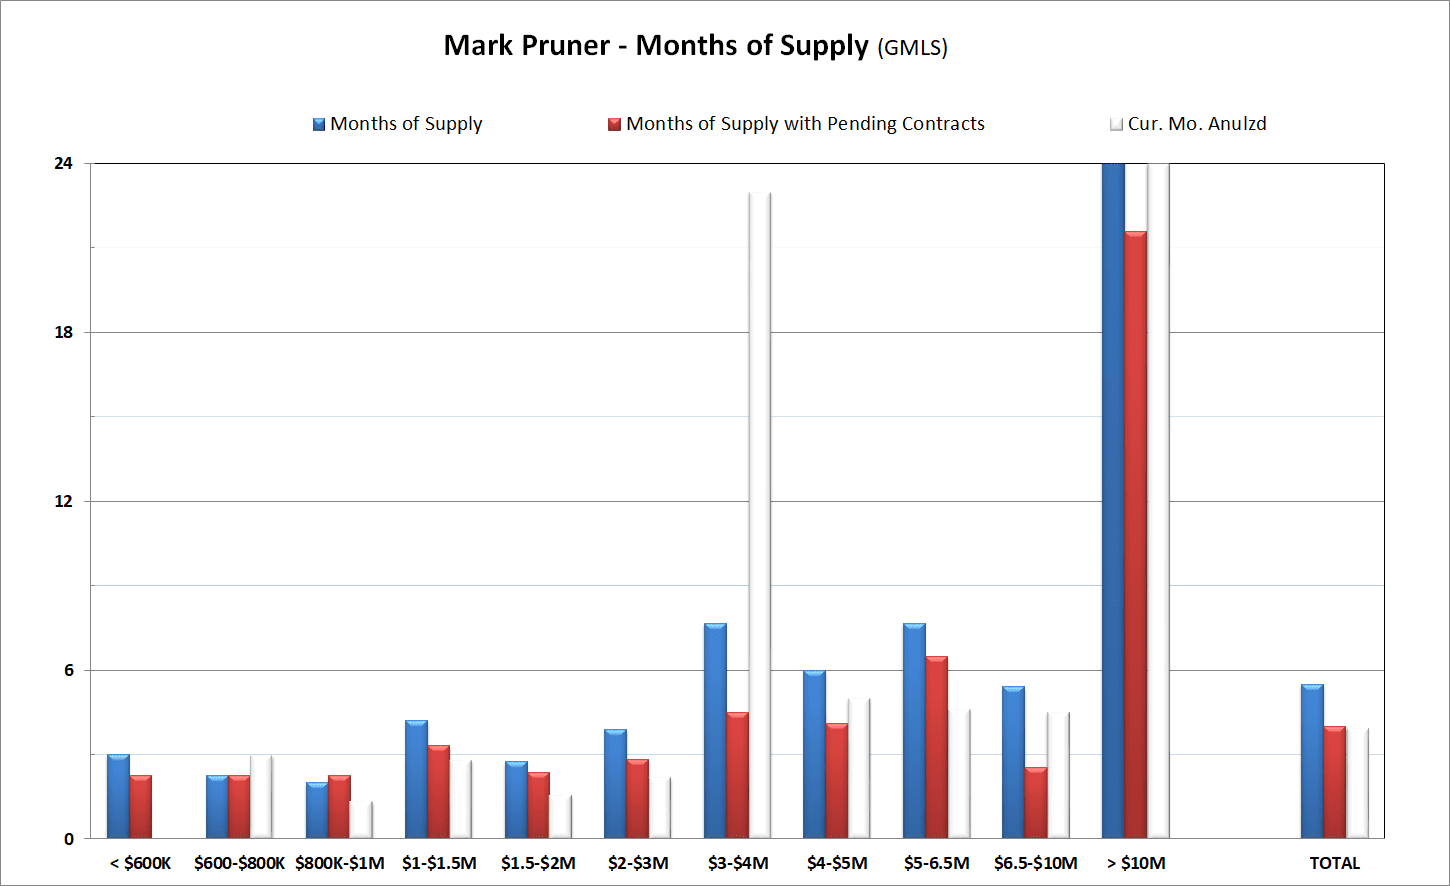
When you look at days on market, you see an accelerating market from $800,000 to $3 million where months of supply with contracts and months of supply based on annualized March sales are each lower than just sales. Above $3 million, the March sales annualized show a more mixed story. The one exception to that is the market from $5.0 – 6.5 million where there is a steady decline in months of supply from 7.7 months of supply counting only sales, to 6.5 months of supply with sales and contracts to 4.6 months of supply when you annualize the 5 houses sold in that price range in March.
Russ and I put on 421 Stanwich Road recently. It is a 7 bedroom, 8 bath, 10,350 s.f. house built in 2000. It sits on 2.3 acres and is priced at $5.49 million. We have been getting steady showing and second showings. It’s a cool house, but it does have 4 more competitors than last year, even with all the sales in this price range.
It’s hard to say without more inventory, just how many buyers are out there particularly, at the high-end, but the short answer is more than enough buyers for the inventory that we do have. The market is a pro-seller market, but location and particularly condition are a much more critical factor this year.
Stay tuned, April will be a key month this year.