Is Greenwich, CT a Buyer's or Seller's Market in 2026?
Russell Pruner | September 4, 2026
Blog

Russell Pruner | September 4, 2026
Blog
Ask five people about Greenwich, CT real estate right now and you will hear five different answers on whether it favors buyers or sellers. Several of them could be right. Inventory is thin, homes are selling fast, and prices are up across the board, that part points to sellers. But break it down by price and the picture splits. Under $4 million there is almost nothing to buy. Above $8 million there is real room to negotiate. Condos are moving in the opposite direction from houses entirely. Here is what the Greenwich MLS data actually shows as of September 1, 2026, and what it means for you depending on where you are looking and what you are trying to do. But numbers on a page only go so far. What they mean for your street, your price, and your timing is worth talking through, and I would like to be the one you talk it through with.
Not many. On September 1, 2026, there were 80 single-family homes for sale in all of Greenwich, plus 26 condominiums and 12 parcels of land. As of the last week of August the whole town had 130 active listings, down 16% from the same week in 2025. Single-family inventory was 81 homes against 99 a year earlier, down 18%. 2025 was already the historic low for inventory in Greenwich, and now we have gone lower.
This year's high point came on July 24 at 121 single-family homes. Last year peaked at 154 in early June. Through the first eight months of 2026 there has not been one Friday when single-family inventory was above the same Friday in 2025.
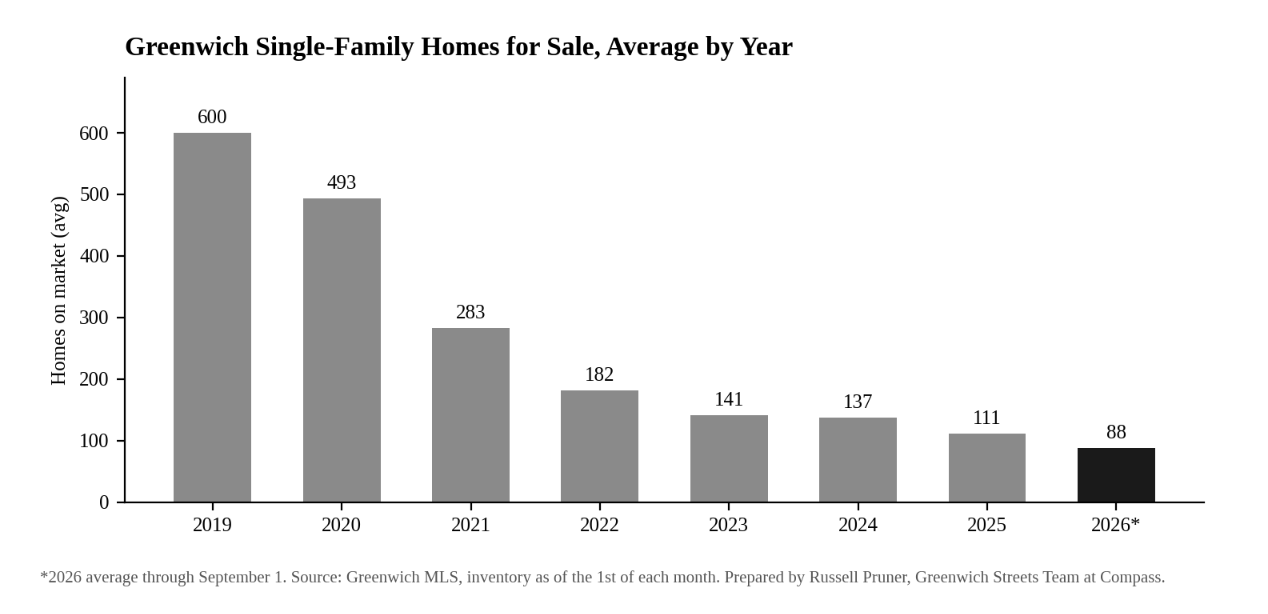
The longer view is the real story. Here is the average number of single-family homes on the market in Greenwich, year by year
A buyer shopping Greenwich today is choosing from about one seventh of what a buyer saw in 2019. The Greenwich Streets Team at Compass has tracked this every Friday for years, and the trend line has not turned.
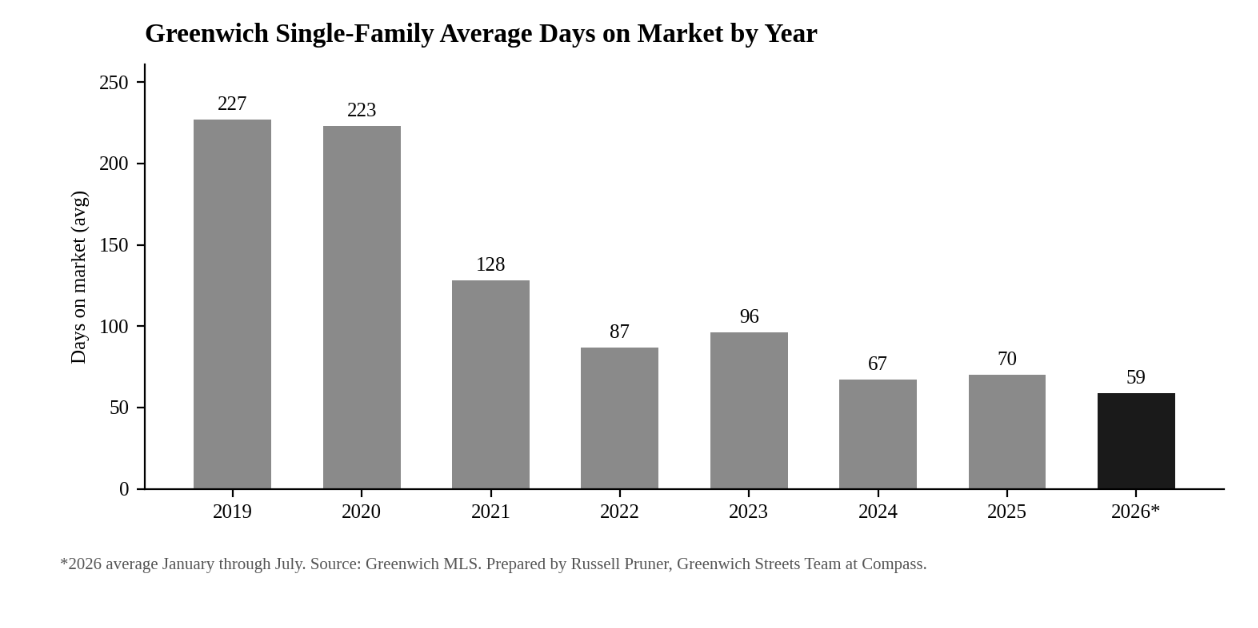
Fast. Single-family homes averaged 36 days on market in July and 37 in June. For the year through July the average is 59 days. In 2025 it was 70. In 2023 it was 96. In 2019 it was 227. A home that used to take seven months to sell now takes about two, and the well-priced ones are going in weeks.
Thin supply and quick sales together tell you where the leverage sits. In most of Greenwich it sits with the seller, as long as the home is priced right, in good condition, and has no locational negatives.
Through July, 305 single-family homes closed in Greenwich, almost exactly the 304 that closed in the same period last year. What changed is the price. The town-wide median sale price rose to $3,602,000 from $3,150,000 a year earlier, a gain of 14%. Same number of sales, a lot more money per sale.
Riverside, Old Greenwich and Cos Cob are all up double digits. Riverside's median through July is $3,681,000, up 17% from $3,150,000. Old Greenwich is at $3,525,000, up 17% from $3,002,500. Cos Cob is at $2,400,000, up 20% from $1,995,000, the biggest jump of the three, although Cos Cob closed only 27 sales against 38 last year because there was so little to buy.
No, and this is the part a town-wide snapshot misses. Break the 80 single-family homes down by price and you get two different markets.
Under $2 million there were 17 homes for sale on September 1, and only four of those were under $1 million. Back in 2019 Greenwich averaged more than 100 homes under $1.5 million on the market at any given time. This year it averages five. If you own a well-kept home in this range, you are in one of the tightest seller's markets Greenwich has ever seen.
Between $2 million and $4 million there were 17 homes. That is a strong seller's market by any measure. In 2019 the same range averaged over 200 homes.
Above $8 million there were 24 homes, including 18 priced at $10 million and up. That is 30% of all single-family inventory in Greenwich sitting in the top tier. Homes here tend to sit longer and sell with more room to negotiate, for a simple reason. The pool of buyers for a multi-acre, multimillion-dollar property is smaller than the pool for a well-located colonial close to town. Two sellers a mile apart can be living in two completely different markets.
Yes, and it is worth its own paragraph. Condo and co-op sales are up sharply. Through July there were 115 closings against 92 last year, a 25% increase, and the median price crossed $1 million for the first time, reaching $1,075,000 from $960,000. Buyers priced out of the single-family market are turning to condos, and it shows. This tells us buyers still want everything Greenwich has to offer. They are just finding a different way in.
At the same time, condo inventory is the one number in Greenwich moving up. There were 26 units for sale on September 1, the highest count of the year and well above the 2026 average of 17. Condos are also taking longer to sell than houses, 55 days on average this year. A condo buyer has more to choose from than they did in the spring. A condo seller has more competition.
Price it right on day one. That matters more this year than it has in a while. Under $4 million, a well-priced home in good condition can draw real competition within days, because there are only 34 homes for sale in that range across the whole town. Overprice it, even a little, and you risk sitting long enough to lose that momentum. Once a home has been on the market for a while, buyers start asking what is wrong with it, and that changes how they bid. At $8 million and above, where you are one of 24 homes competing for a small group of buyers, patience and a strong presentation will do more for you than urgency.
One more thing worth knowing. Greenwich inventory usually climbs in September. Last year single-family inventory went from 99 homes in late August to 131 by mid-September. If you are planning to list this fall, the sooner you are on the market, the less you are competing against.
Know which market you are actually in before you write an offer. If you are competing for a move-in-ready home under $4 million, you will likely need to move fast and come in strong. There is no backlog of alternatives waiting for you. If you are looking above $8 million, or at a home that has been sitting, you may have real room on price or terms. The mistake I see most often is buyers using the same playbook at every price point when the data says they should not. Days on market and recent sale prices for that specific street tell you how much leverage you have. The Greenwich Streets Team at Compass pulls those numbers before every offer we write.
Every number in this post is real, and every number changes depending on your street, your price, and your timing. If you want to know what they mean for you specifically, call or text me at 203-524-4998, or email [email protected]. I will walk through it with you.
Russell Pruner | Senior Real Estate Specialist | CRS | GRI | SRES | Six-Time GAR-GMLS President | 40+ Years in Greenwich | Greenwich Streets Team at Compass
The Greenwich Streets Team has been named RealTrends Verified for 2026, placing them among the top 1.5% of real estate professionals nationwide.
As of September 1, 2026, there were 80 single-family homes, 26 condominiums, and 12 land parcels for sale in Greenwich. Single-family inventory is running 18% below the same point in 2025 and about one seventh of the 2019 average.
Single-family homes averaged 36 days on market in July 2026 and 59 days for the year through July, down from 70 days in 2025 and 227 days in 2019. Condos are averaging 55 days this year.
The town-wide single-family median sale price through July 2026 is $3,602,000, up 14% from $3,150,000 in the same period of 2025. The condo and co-op median is $1,075,000, up from $960,000.
For well-located, well-priced homes, yes. With only 34 homes for sale under $4 million across the whole town, conditions strongly favor sellers. Above $8 million it depends on how your home stacks up against the 24 others competing for the same buyers.
In-town areas like Old Greenwich, Riverside and Cos Cob, especially under $4 million, are the tightest. Cos Cob in particular had so few homes to buy that sales fell 29% while the median price rose 20%. Backcountry and the larger estate sections offer more breathing room.
Will the Greenwich market shift in the second half of 2026?
Inventory and mortgage rates are the two things to watch. Greenwich inventory typically rises in September and falls again by November. I track both every week and am glad to walk you through what is changing and what it means for your situation.
Every number in this post is real, and every number changes depending on your street, your price, and your timing. If you want to know what they mean for you specifically, call or text me at 203-524-4998, or email [email protected]. I will walk through it with you.
Last updated: September 2026. Source: Greenwich Multiple Listing Service.
Stay up to date on the latest real estate trends.
Blog
How It Has Moved Since 2019

Blog

Blog
What Long-Time Owners Need to Know

Blog
Market Report

Blog
Market Report

Blog

Blog
Discover the best places to live across Greenwich
We are a dedicated group of Greenwich natives. We have a deep passion for our hometown and enjoy everything the town offers its residents from the beach front to the backcountry. That is why we don’t find you just any home, we find you the right home.
MARK PRUNER
DENA ZARRA
RUSSELL PRUNER
COMPASS
200 Greenwich Ave
3rd Fl Greenwich, CT 06830