July 2026 Greenwich Market Report
Mark Pruner | August 26, 2026
Market Report

Mark Pruner | August 26, 2026
Market Report
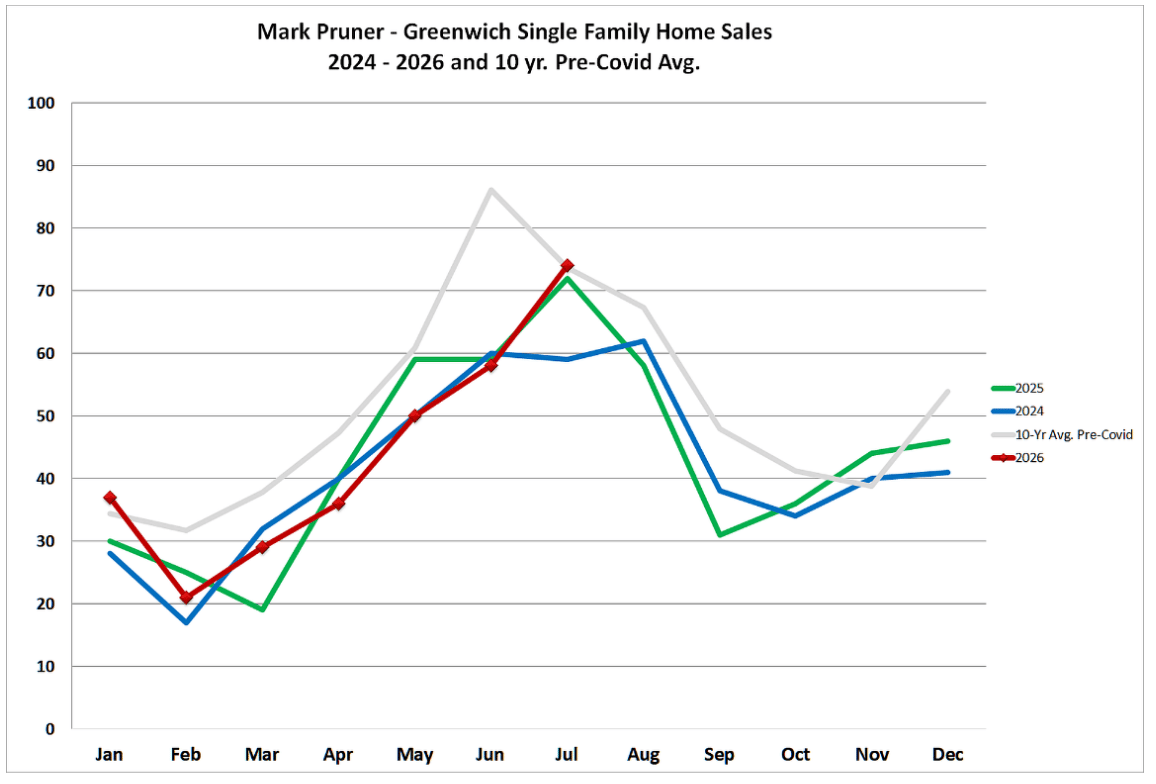
Sales of single-family homes soared in July. We sold 74 houses last month, which is 28% more sales than we had in June 2026. Traditionally, June is our biggest month for sales, followed by July. This year, like last year, we had more sales in July than in June. That “tradition” may soon be put to rest. In 7 of the last 9 years, we have had more July sales than June sales. The nine years prior to that saw only one July with higher sales than June. This change is not just a statistical curiosity. It gives sellers more time to get to market.
Sellers are putting on their houses later in the year. This is curious, because a few sellers are putting on their houses even earlier, the week before the Super Bowl, instead of the week after, which was thought of as the beginning of spring market. (I’ve always thought that it should be called the “late winter “ market. Then again, who wants to say they got listed early in the late winter market.)
Sellers know that houses show best in the spring market with green grass, blooming trees and bushes, and warmer, more invigorating days. It’s days like that that make a buyer reach for their checkbook or, more likely today, their wire transfer instructions. The old philosophy was that you didn’t want to be overwhelmed by competing listings, so you wanted to list earlier in the year, not in May when our inventory generally peaks. This rule is also not as hard and fast as it was pre-Covid. In a hot market with only a couple of months of supply at any time in the year is a good time to list.
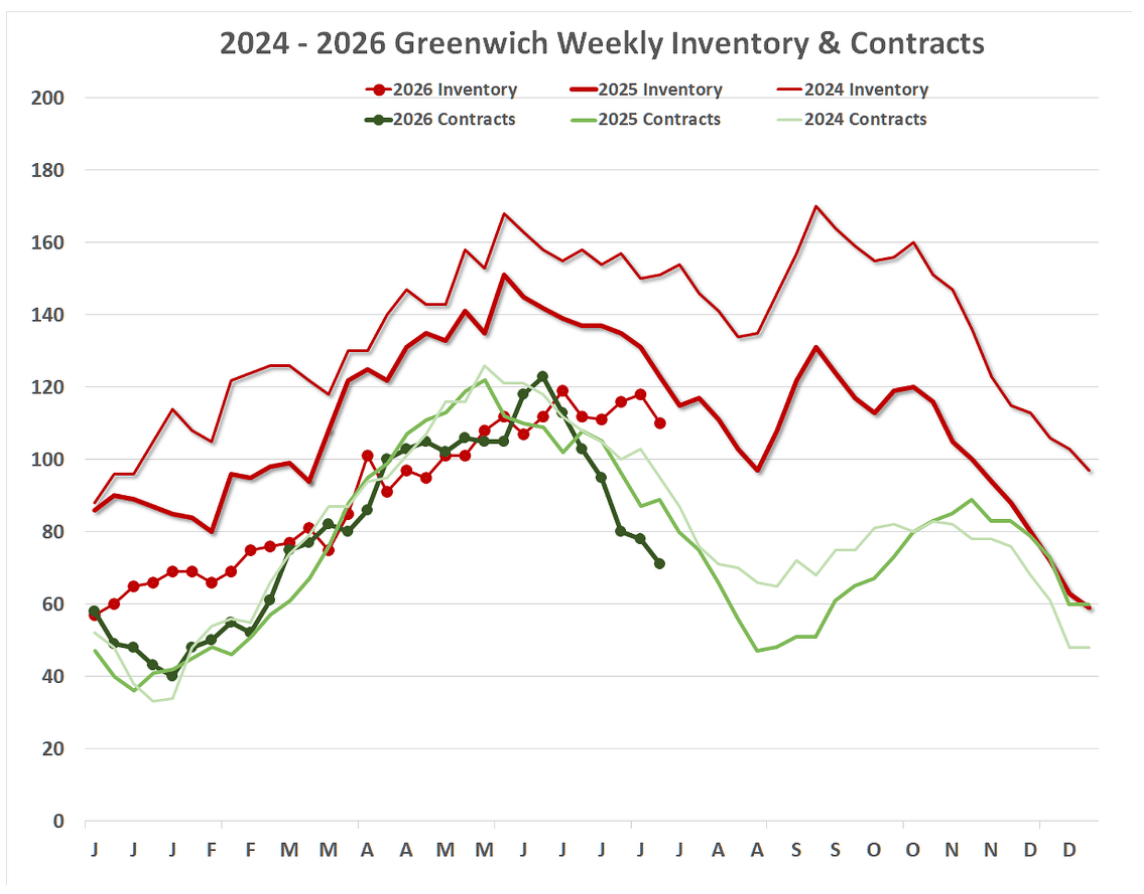
Every month is like a new market. Your competition is down every month, as any listing that is decent goes to contract quickly. In July, the median days on market was only 12 day. So far in 2026, the median DOM is only 17 days. Yes, inventory went up from February to May, but it was a very paltry inventory compared to prior years. This year, each week’s inventory down 70- 85% from what we had in 2019.
You should feel free to list later if you have a good house. You don’t have much competition in any month or any price range under $10 million.
But back to our excellent July 2026 sales. Of our 74 sales, 11 of them were in the last two days of July, and this has carried over to the first week of August. These 74 sales are right at our 10-year pre-Covid average for July. This is really remarkable. In our pre-Covid days, we had 450 to 600 listings in July. In our last pre-Covid year, we had 641 listings at the end of July 2019.
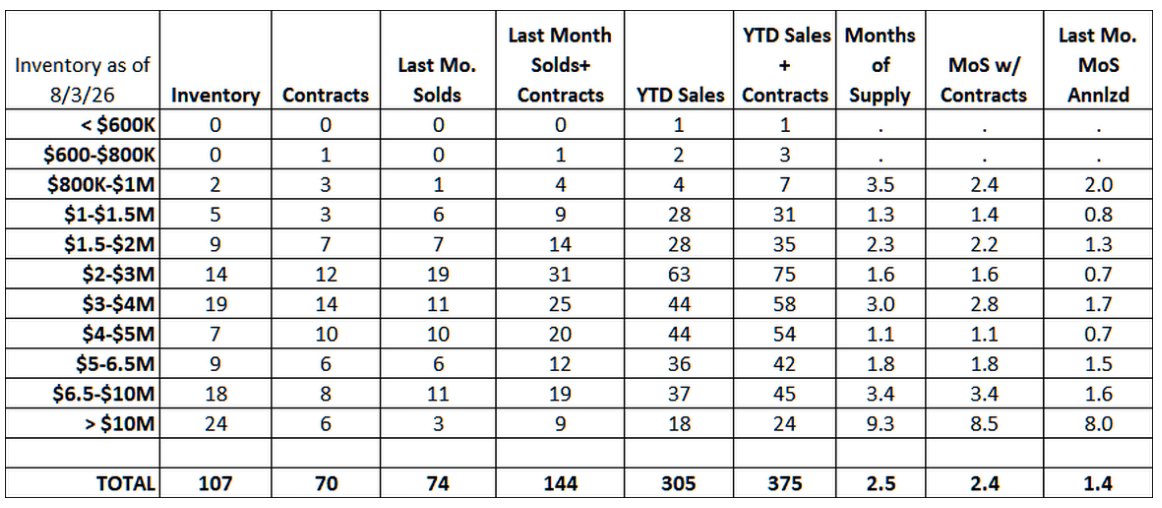
We also had 72 sales in July 2019. Put another way 11% of our listings sold in July 2019. Fast forward to this July, and our inventory was only 107 listings. This means that with 74 sales out of 107 listings, 69% of our listings sold in one month. That’s how you get to 1.4 months of supply. If you look at the sales by month, you see a sharply angled and nearly straight line from March to July. Extend that line, and you might guess that we are going to have around 90 sales in August.
There is no way that is going to happen. First, we only have 98 listings as of the first week of August. Second, our contracts have been dropping faster than in previous years. Right now, we only have 74 contracts, and they are not all going to close in August. Even if they did, we’d need another 16 super blue moons in August, i.e., houses that come on in August and close before the end of the month. Last August we had 58 sales, we will be doing well if we get to that number this August.
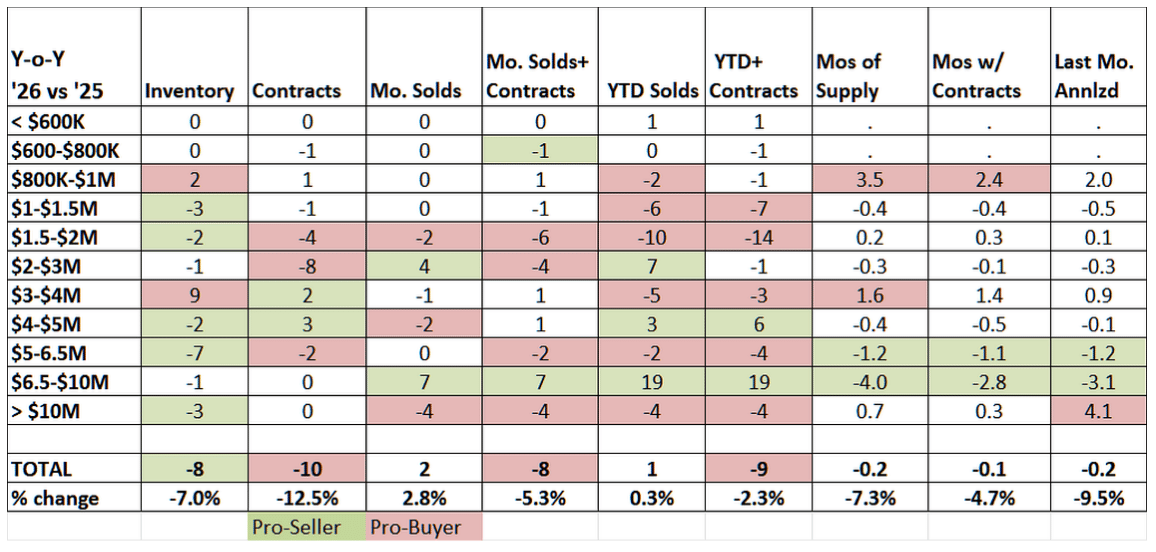
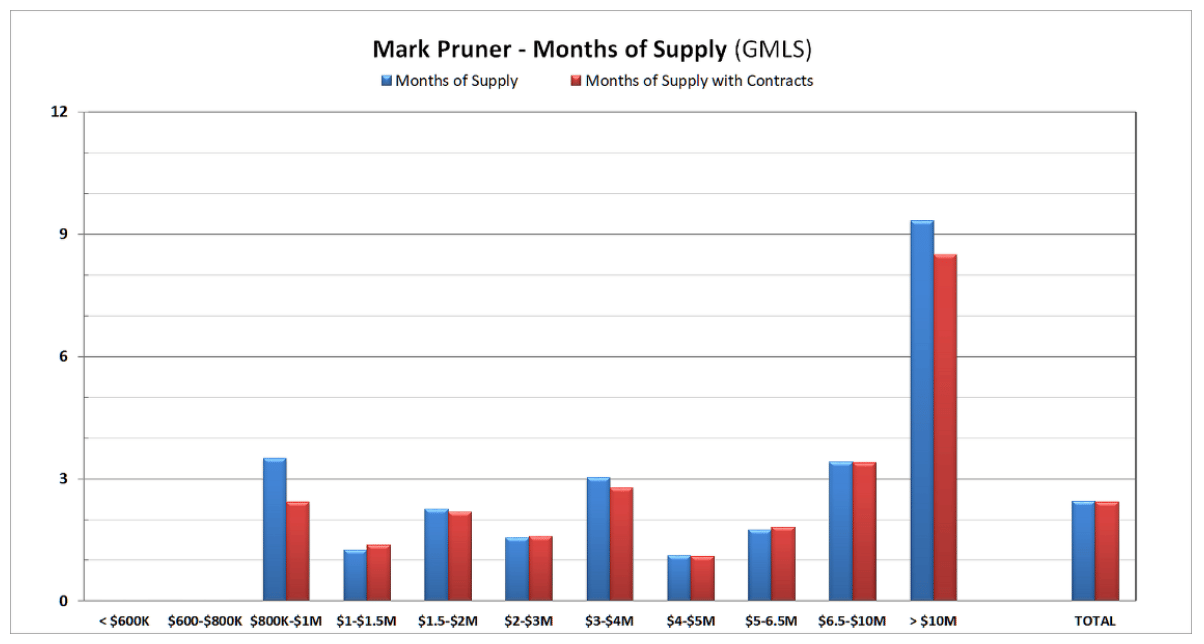
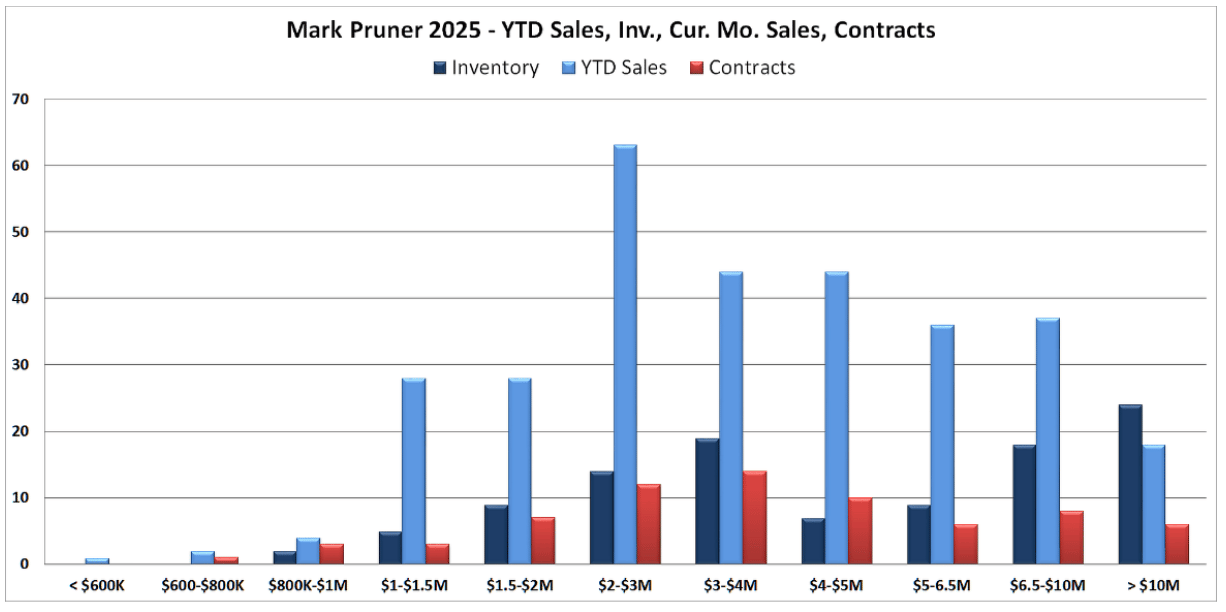
So, the headlines are excellent, July 2026 sales at the expense of the number of contracts and very low inventory, but what about the details? Our inventory is so low that much of the changes from last year are just Brownian motion, or chatter or random walk, depending on what jargon you use in your industry. Some notable inventory changes from last year; we are up 9 listings in the $3 - 4 million price range. At the same time, we are down 7 listings in the $5 – 6.5 million price range. The price ranges on either side of those two price ranges are about the same, so I’m not sure that’s a trend.
Contracts do have a bit of mini-trend. Our contracts from $1.5 – 3 million are down 12, for last year from 31 contracts last year to only 19 contracts this year. Less inventory means less sales.
From $3 – 5 million contracts are up 5 sales going from 19 contracts last year to 24 contracts this year. This is a 26% jump, which looks like something significant, but is probably just the law of small numbers. When the numbers are small, a small increase in the absolute number equates to big jump in percentages, but probably really isn’t significant.
What probably is significant is what we are seeing from $6.5 – 10 million. In 2025 we had 18 sales from $6.5 – 10 million. This year, sales from $6.5 – 10 million are up to 37 sales or a 106% increase.
At the same time, sales over $10 million are actually slightly down from 22 sales to 18 sales this year. One argument is that our very high-end sales have shifted down one price range, and we are seeing more buyers in that price range.
At the low end of the price ranges, our sales are down as inventory is down, even below the very low inventory of prior years. We only have 2 listings under $1 million; go up another $500K, and you only get 5 more listings.
The one curiosity is that our inventory didn’t drop faster in June and July. For the last 8 weeks, inventory has varied between 107 and 118 listings instead of dropping steadily. That, however, may be changing. We ended July with 110 listings, but in just the first 5 days of August we have dropped another 12 listings to 98 listings: sinking below 100 listings for the first time since the end of April.
Last week we had 21 sales and only 4 new listings. Given the August doldrums and the jump in listings after Labor Day, we won’t really be sure whether the market is softening until the end of September. We are likely to see some new all-time record lows set for weekly inventory in August.
Either way at this point, at best or worst, depending on what side of the deal you are on, the market is going from the hardness of a diamond to the hardness of a sapphire. (For those of you whose fathers weren’t a geologist, that is going from a 10 to a 9 on the Mohs scale.)
To succeed in this market, you should get a good Realtor and come prepared.

Stay up to date on the latest real estate trends.

Blog
How It Has Moved Since 2019

Blog

Blog
What Long-Time Owners Need to Know

Blog
Market Report

Blog
Market Report

Blog

Blog
Discover the best places to live across Greenwich
We are a dedicated group of Greenwich natives. We have a deep passion for our hometown and enjoy everything the town offers its residents from the beach front to the backcountry. That is why we don’t find you just any home, we find you the right home.
MARK PRUNER
DENA ZARRA
RUSSELL PRUNER
COMPASS
200 Greenwich Ave
3rd Fl Greenwich, CT 06830