June 2026 Greenwich Market Report
Mark Pruner | July 8, 2026
Market Report
Mark Pruner | July 8, 2026
Market Report
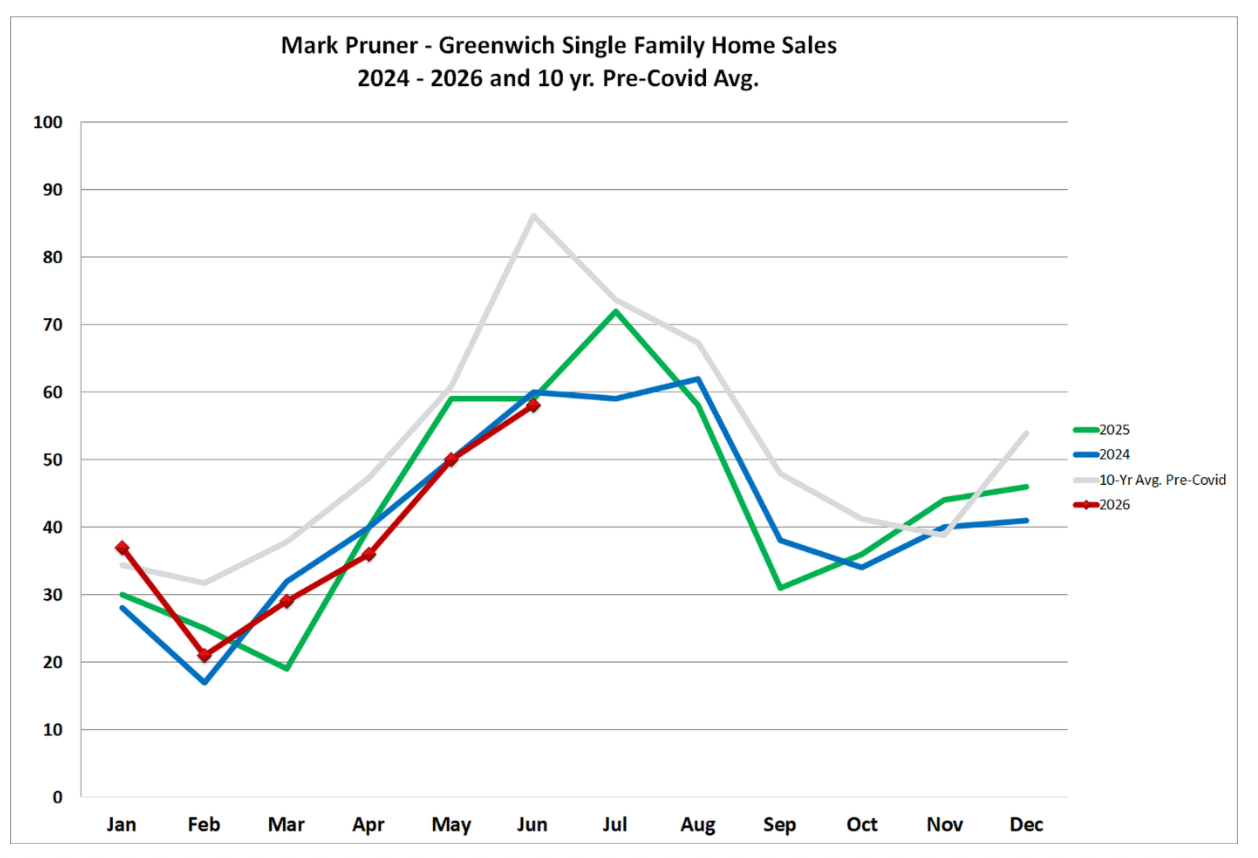
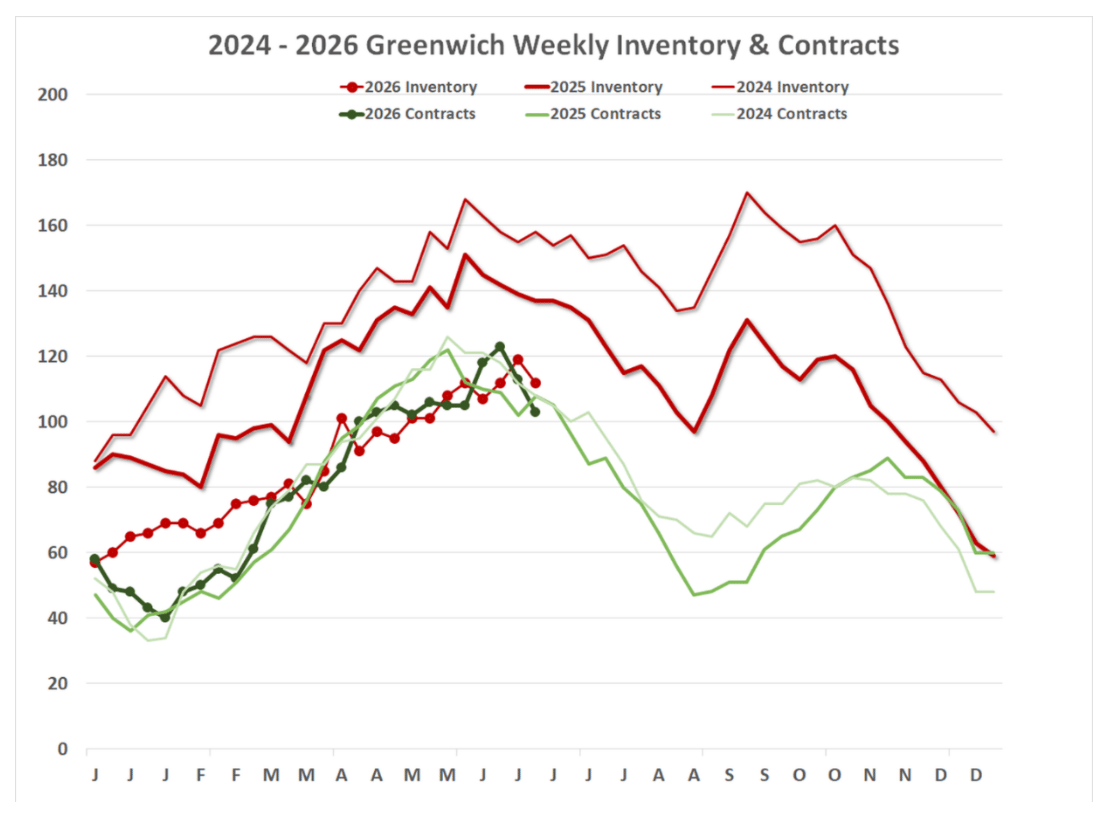
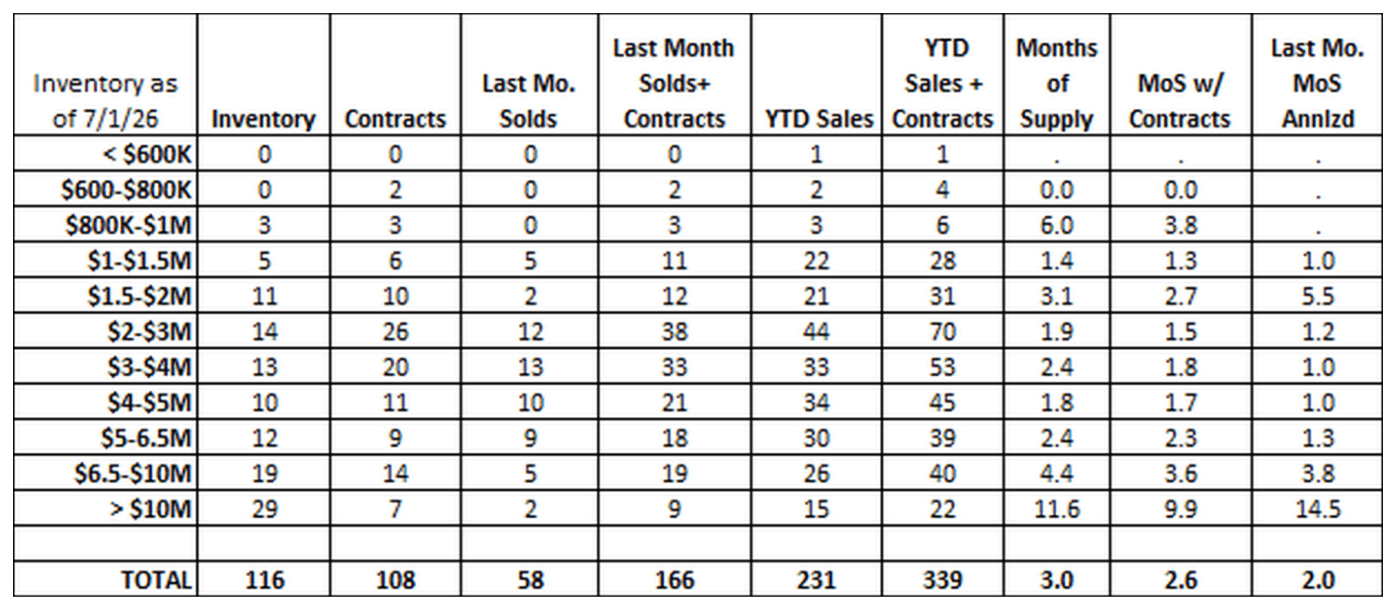
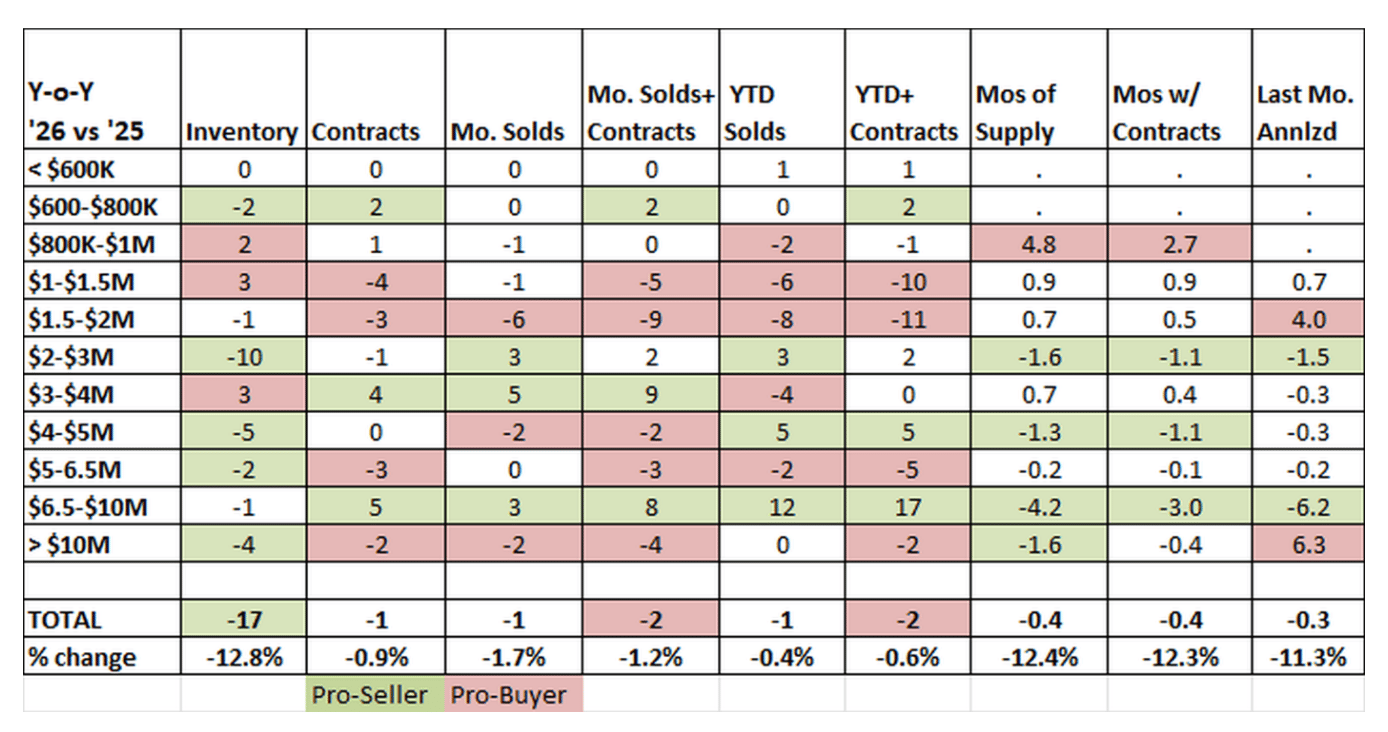
So far, 2026 is the year of doing more with less, or to be more accurate, it is the year of doing just about the same as last year with less. In the first half of 2025, we sold 232 single-family homes. This year, we sold 231 houses. In June 2025, we sold 59 single-family homes. This June, we sold 58 houses. In June 2025, we had 109 contracts waiting to close. This year, we have 108 contracts waiting to close.
Our other indicators of market demand are the same or higher in 2026. Our median sales price for the first half of 2026 is $3.71 million up $461,000 from last year. This is a median sales price increase of 12.4% from last year’s median sales price of $3.25 million. This does not mean that your house went up 12.4% in the last year (though it certainly went up)! Prices did go up. For example, the price/sf went from $813/sf to $901/sf or an increase of “only” 10.8% year over year.
If I’m only allowed one number to look at to determine appreciation, I like to use the SP/Assessment ratio. Us realtors like to smugly toss about the sales price to assessment ratio, but what is the SP/Assmt ratio, and can it be trusted? The sales price to assessment ratio went from 2.19 last year to 2.42 this year or an increase of 10.5%, very similar to the 10.8% appreciation in the price/sf, so on its face it looks trustworthy in this situation.
For me the level of trustworthiness for appreciation stats is first sales price to assessment ratio usually followed pretty closely by sales price per square foot. The year over year change in the median price and particularly the change in the average price is less trustworthy. These latter two stats are often greatly influenced by mix of what is selling. We have fewer sales under $2 million this year, so both the average price and the median price increase do not do a good job of showing overall market appreciation.
To figure out the SP/Assmt ratio you need to start with the assessment. Every five years, the Greenwich Assessor Office is mandated by law to reassess every property in town as of October 1 of that year. They determine what the fair market value of the property is on that date and then apply the state mandated 70% assessment ratio to get to the property’s assessed value. (Actually, an outside service does this, then the people in the Assessor’s office tweak these values for known issues like strange lot shape or being next to the highway.)
So, let’s say a property had a fair market value of $10 million on October 1, 2025, our new revaluation date. The assessed value of that $10 million property is 70% of FMV or $7 million Say it sells six months later for the same value of $10 million as the Assessor’s calculated fair market value. Now you might think that in that case the sales price to assessment ratio is 1.00, but you’d be wrong. To get the SP/Assmt ratio you start with the assessed value which is $7 million. So, $10 million sale price divided by $7 million assessed value comes out to 1.428.
Bottom line, if your sales price hasn’t changed since the last reassessment your SP/Assmt ratio is 1.42. However, the odds of it not appreciating are low. For this year’s 231 sales to date, the SP/Assmt ratio is highly variable from house to house and varied from 1.15 to 7.89 with a median of 2.42. At the low end that 1.15 SP/Assmt ratio would be a decline of 20%. There are two reasons that the house might have declined in value. The house might have has a physical change in the property or the Assessor’s revaluation was too high.
Physical changes are one of the few reasons that the assessed value changes in the years between the 5-year reassessment. One physical change, that fortunately is uncommon, is if the house burns down. If that happens on or before September 30th, then the assessed value will be readjusted for that year’s Grand List. If it happens on October 2nd or after, then the assessed value for that year’s Grand List remains the same as the house was intact on the October 1st revaluation date. The value of the property will be reduced on next year’s Grand List as of the following October 1st.
On the other hand, what are the odds that the Assessor over valued the house? Those odds are not very good and vary from revaluation to revaluation. In the Covid delayed 2021 revaluation the Board of Assessment appeals had about 250 appeals or only about 1% of the 24,000 property tax reassessments the Assessors does every 5 years. This year, for the 2025 Grand list the BAA got around 980 appeals, still only about 4% of the assessments.
As you might expect the BAA, doesn’t often get appeals from people that are under-assessed, since they get to pay lower property taxes for the next five years. The number of houses under assessed is also not a big number. Every year, the BAA does get a handful of people that want a higher assessment. These people are not stupid or taxophiles; they generally want a higher assessment, because they are about to sell their house. The adjusted tax assessment is one of the things that lenders look at to see if the sales price is in line with the market.
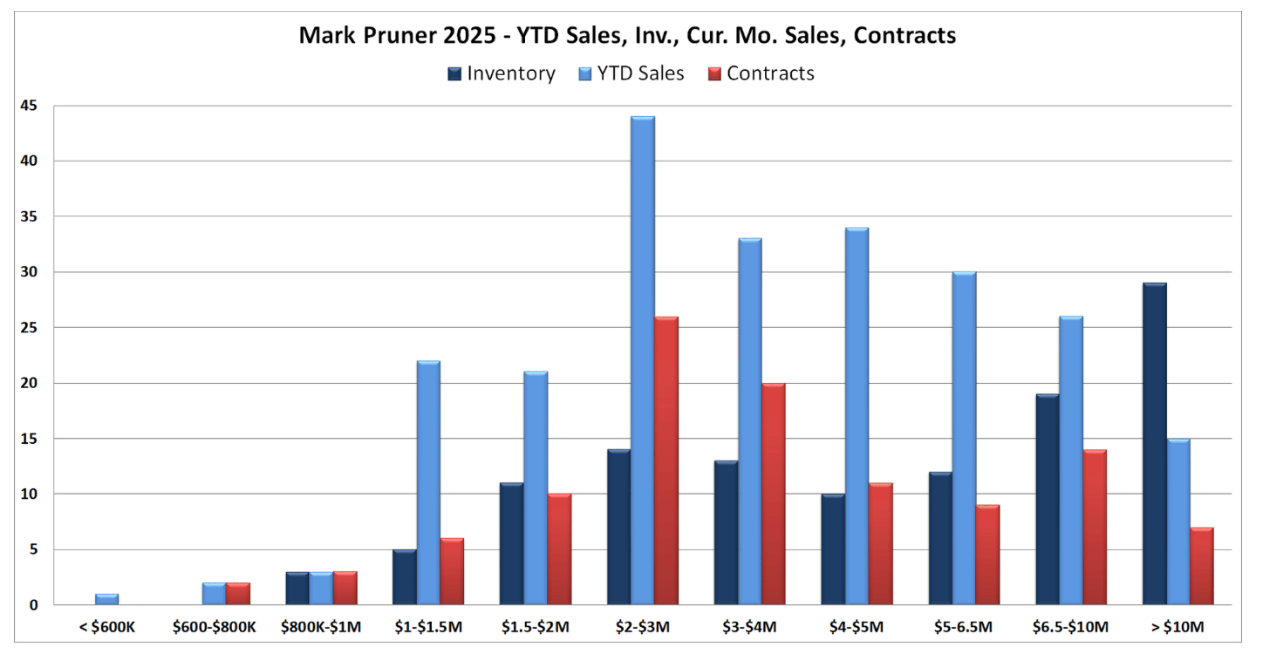
But why even do reassessments every five years? The main reason is that house appreciation varies between neighborhoods and between price points. Since the last revaluation in October of 2021, the Assessor has the town going up 24% on average for single family homes, while the downtown Greenwich area went up 38%. You can see the same variation when you look at the demand by price range. For example, the $6.5 – 10 million price range has seen very good sales and a big drop in days on market.
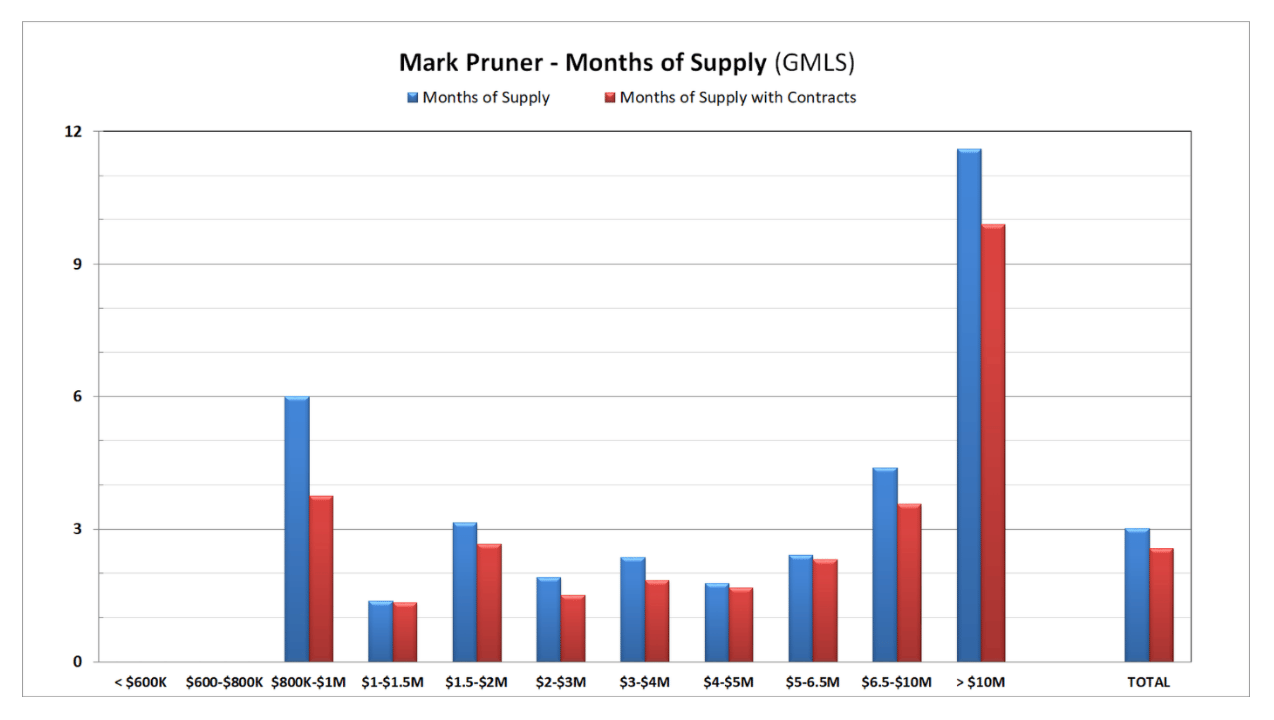
Our over $10 million market isn’t doing quite as well as last year’s all-time record for ultra-high-end sales, but is on track to be the second highest number of sales over $10 million. Even though sale over $10M are down slightly, the months of supply over $10 million has dropped from13.2 MoS to 11.6 months, because the inventory has shrunk faster than sales.
At the same time, the number of sales from $1 – 2 million are down from last year. This is a range where many people use mortgages and higher interest rates are slowing the market. Then again, it’s only a little, from $1 – 1.5 million we only have 5 listings, which at this year’s sales rate is only 1.4 months or 6 weeks of supply.
Greenwich real estate sales in the 2nd half of 2026
So, what is likely to happen in the second half of 2026? The crystal ball is murkier than normal. I’m expecting several black swans; i.e., unpredictable events that can move the market either way. Interest rates and inflation are staying stubbornly higher than we saw earlier this decade, but the President is putting on a lot of pressure to lower them in an election year. Interest rates are still lower than many other pre-Covid years. (Lower interest rates will also help reduce the massive budget debt that the government is running.) The Middle East and fuel prices seem to change every day. Gasoline prices are not a big factor for the Greenwich market, but I just spent $80 filling up my car.
Don’t let these short-term changes make you change your plans. At the same time, be alert for trends that are likely to continue for years. The good thing is that a lot of the smart money lives in Greenwich and are often the first to see these changes.
Stay tuned …

Stay up to date on the latest real estate trends.

Blog
Blog
Blog
Market Report

Blog
Blog

Blog
Market Report
Sales Drop to Recession Levels Mostly Due to Lack of Inventory
Blog
Discover the best places to live across Greenwich
We are a dedicated group of Greenwich natives. We have a deep passion for our hometown and enjoy everything the town offers its residents from the beach front to the backcountry. That is why we don’t find you just any home, we find you the right home.
MARK PRUNER
DENA ZARRA
RUSSELL PRUNER
COMPASS
200 Greenwich Ave
3rd Fl Greenwich, CT 06830